Whereas all other parts of this website focus on advisory work designed to enable clients to obtain improved risk-adjusted returns on their portfolios by focusing on a very small number of key targeted decisions during the course of the year, this page reports instead the results of a backtest of a fully automated trading strategy applied to the DAX cash index. The results presented here are expressed with reference to that market, but the strategy is not specific to it: it can be applied to any other major index, including the S&P 500 (SPX), the Nasdaq 100 (NDX), the Nikkei 225, and India’s NIFTY 50, among others.
The TP Dates CP (Turning Point Dates for Capital Protection) model aims at identifying ex-ante the three or four situations in each calendar year when to “pull the trigger” in relation to protecting the portfolio against the eventuality of important market declines. The Pod Strategy, by contrast, has a much higher trading frequency, of slightly less than one trade per day, on average.
The two therefore cover, to some extent, both extremes of the spectrum: infrequent, ex-ante capital-protection triggers at one end, and a higher-frequency, fully systematic pod-type strategy at the other. Nevertheless, the two approaches share two very critical features: both give priority to capital protection against severe drawdowns, and both require that all positioning be known in advance (one year ahead for the TP Dates CP and one week ahead for the pod strategy).
Instrument
DAX cash index (the strategy can be applied to any major index)
Approach
Fully automated trading strategy
Trading frequency
Slightly less than one trade per day, on average
Positioning range
From 100% net short to 120% net long
Average net exposure
Approximately 20% net long (versus 100% for the benchmark)
Backtest period
Since 1960 (recent years presented below)
In backtest, the strategy has performed well in general but particularly so in bear markets. That profile is structural rather than accidental. The strategy runs an average net exposure of approximately 20% net long, whereas the benchmark is 100% net long at all times and is therefore intrinsically much more risky. A permanently fully invested position absorbs the full force of every important market decline; the strategy is, on average, only lightly exposed on the long side, and it may move anywhere within a range that extends to 100% net short. Despite its light average net long exposure, the strategy has also shown itself capable of capturing upside movements, aided by its ability to detect recurring patterns behind price movements, and has therefore achieved a return profile that is highly asymmetrical relative to the exposure taken.
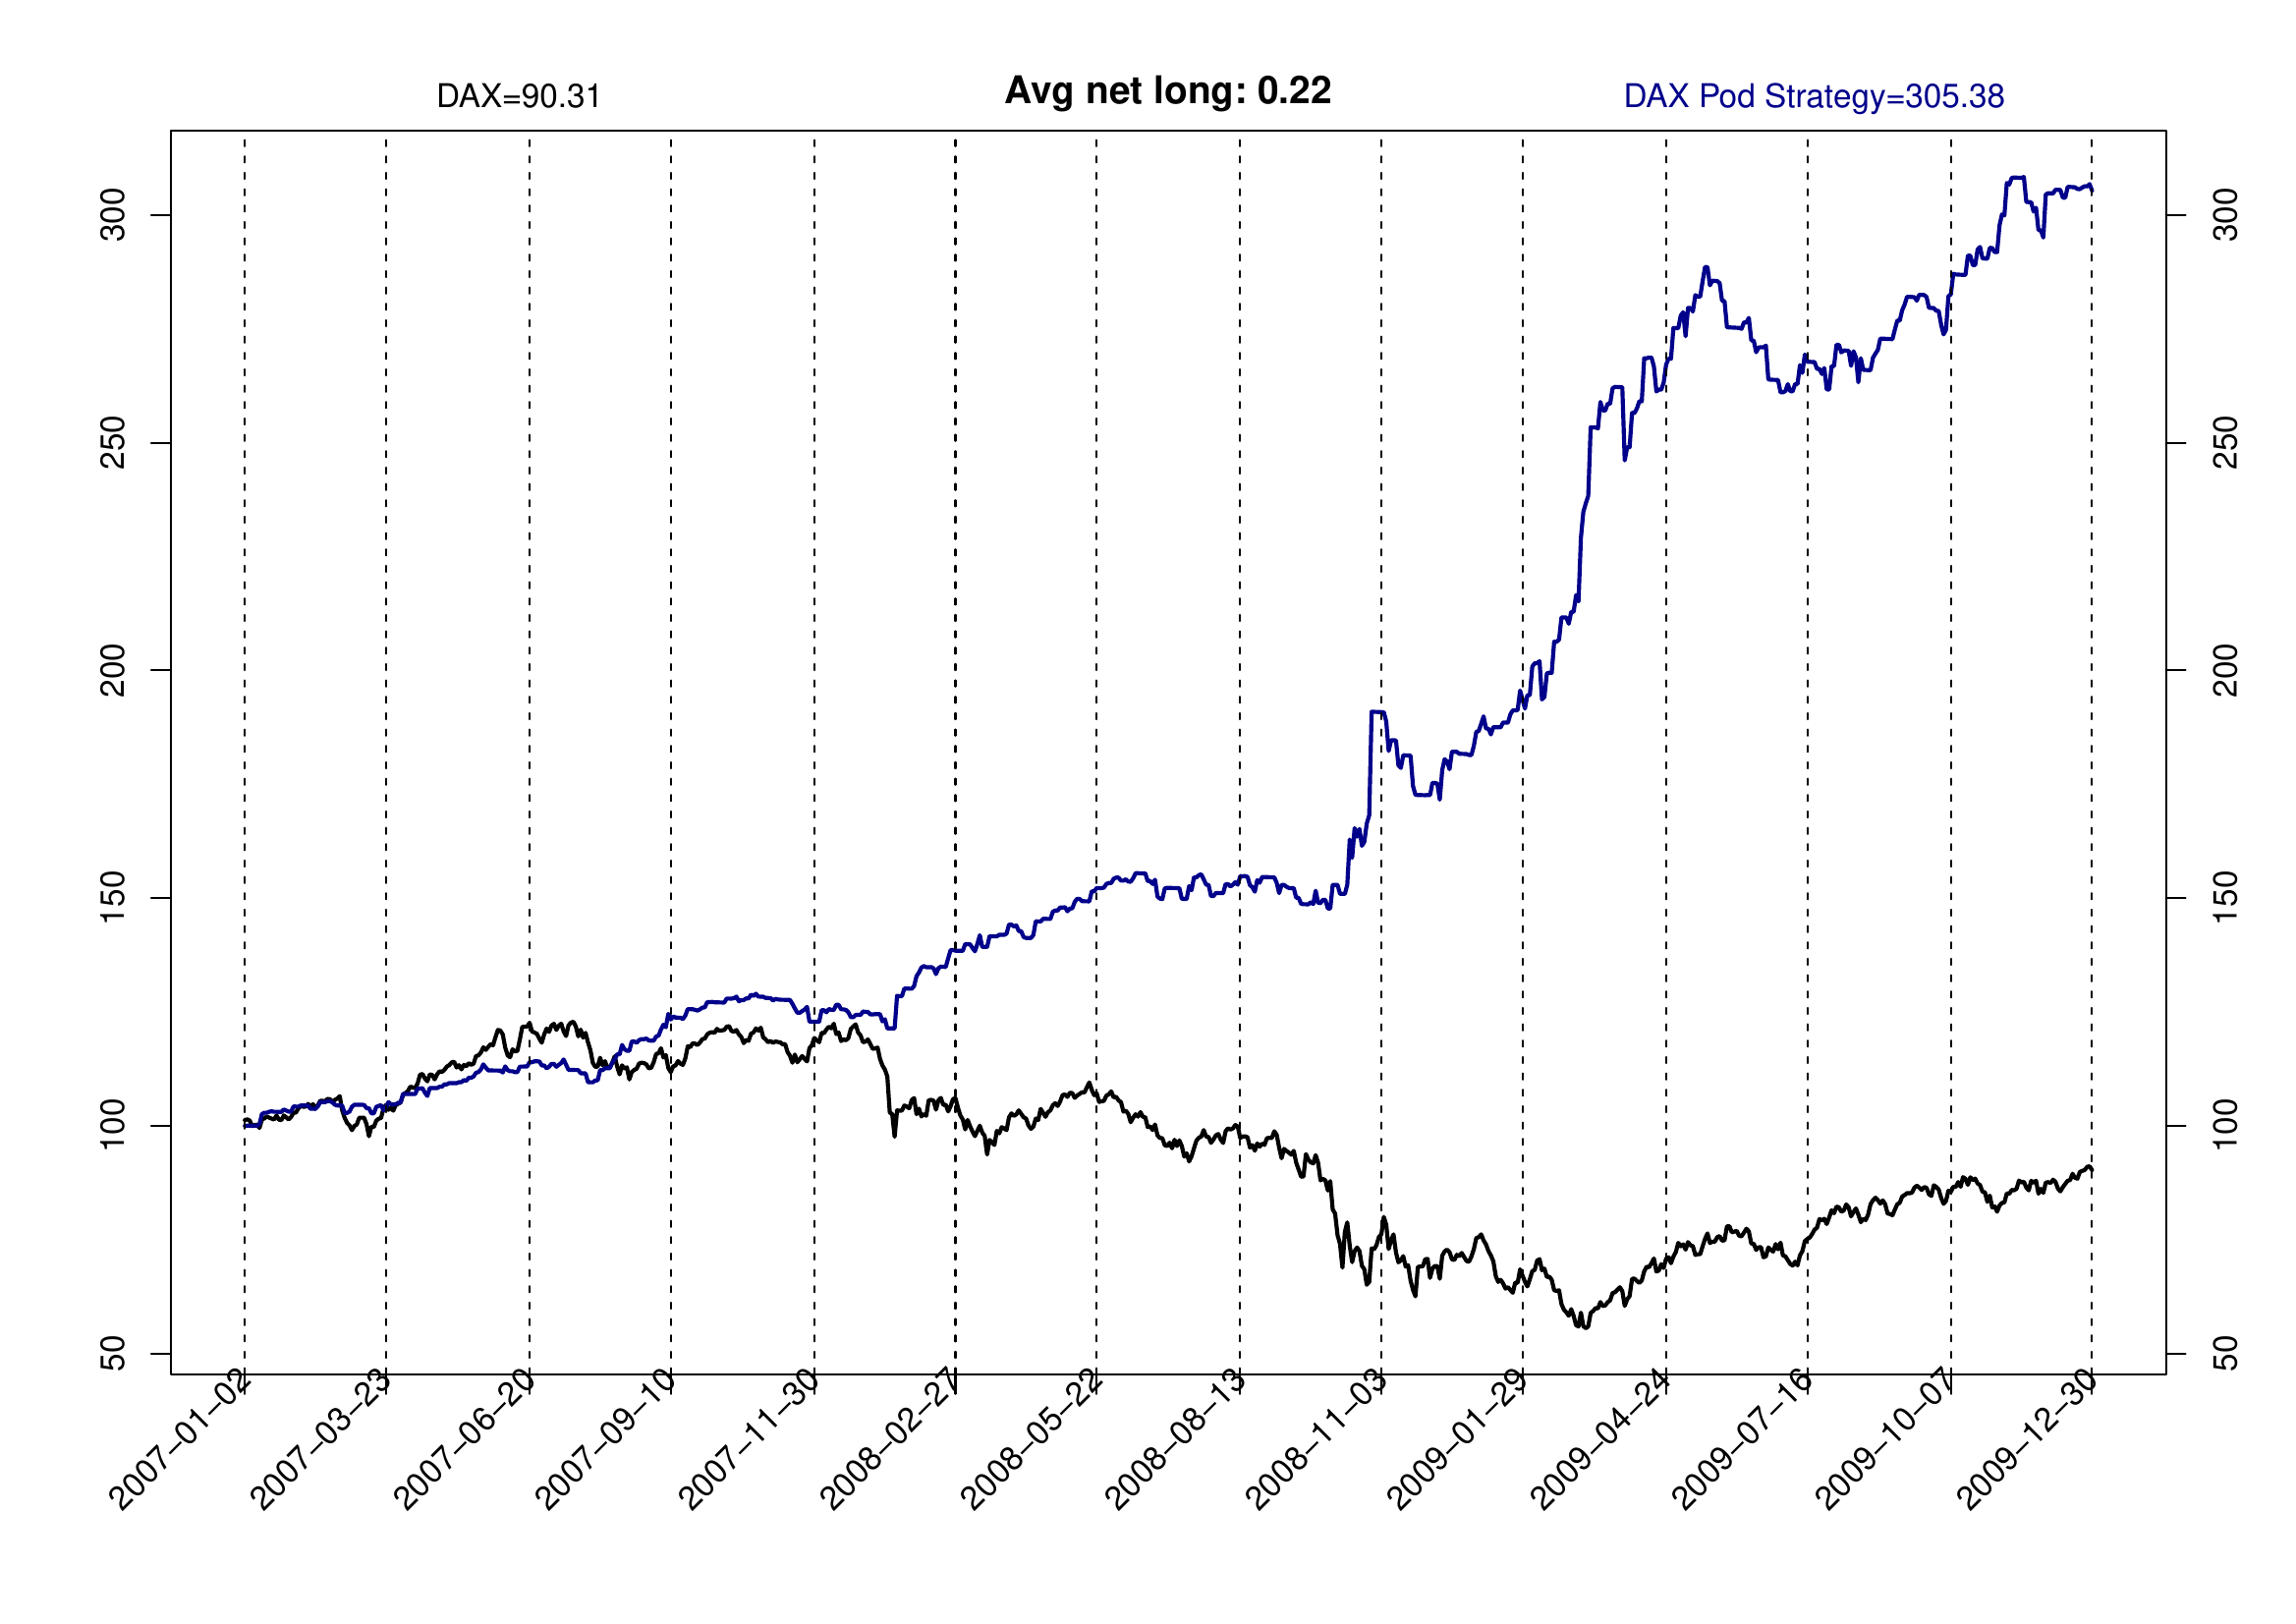
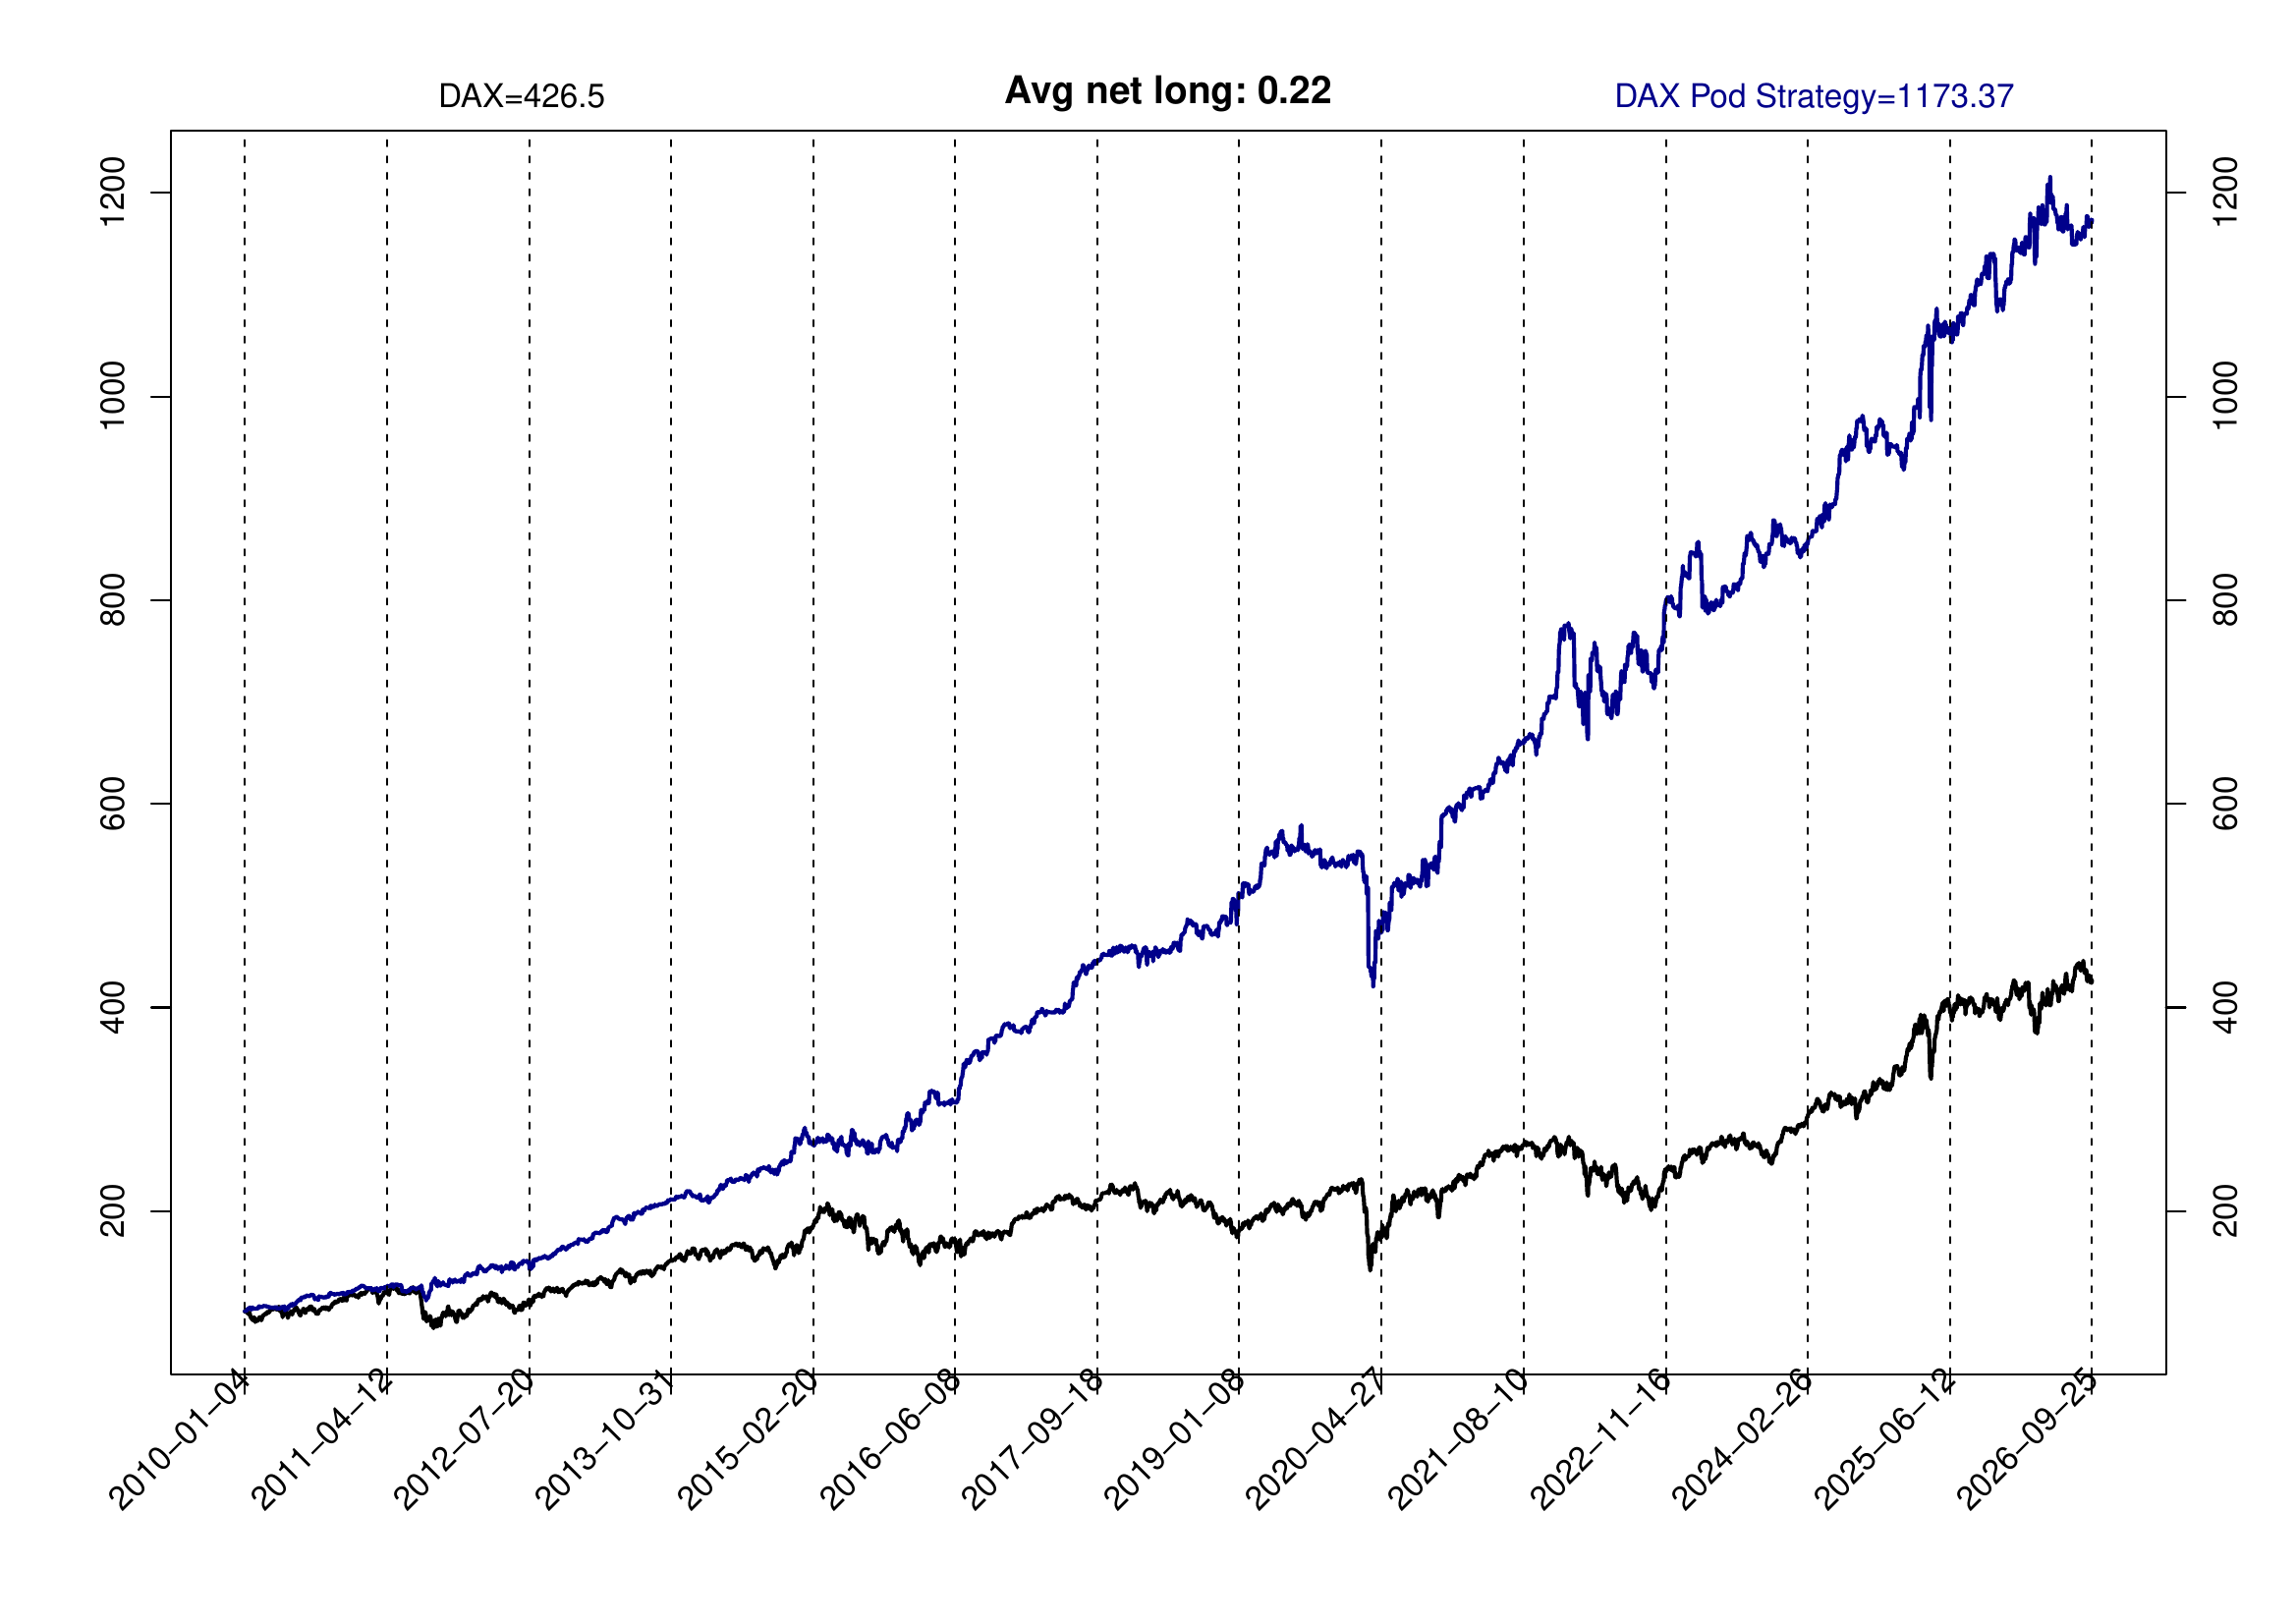
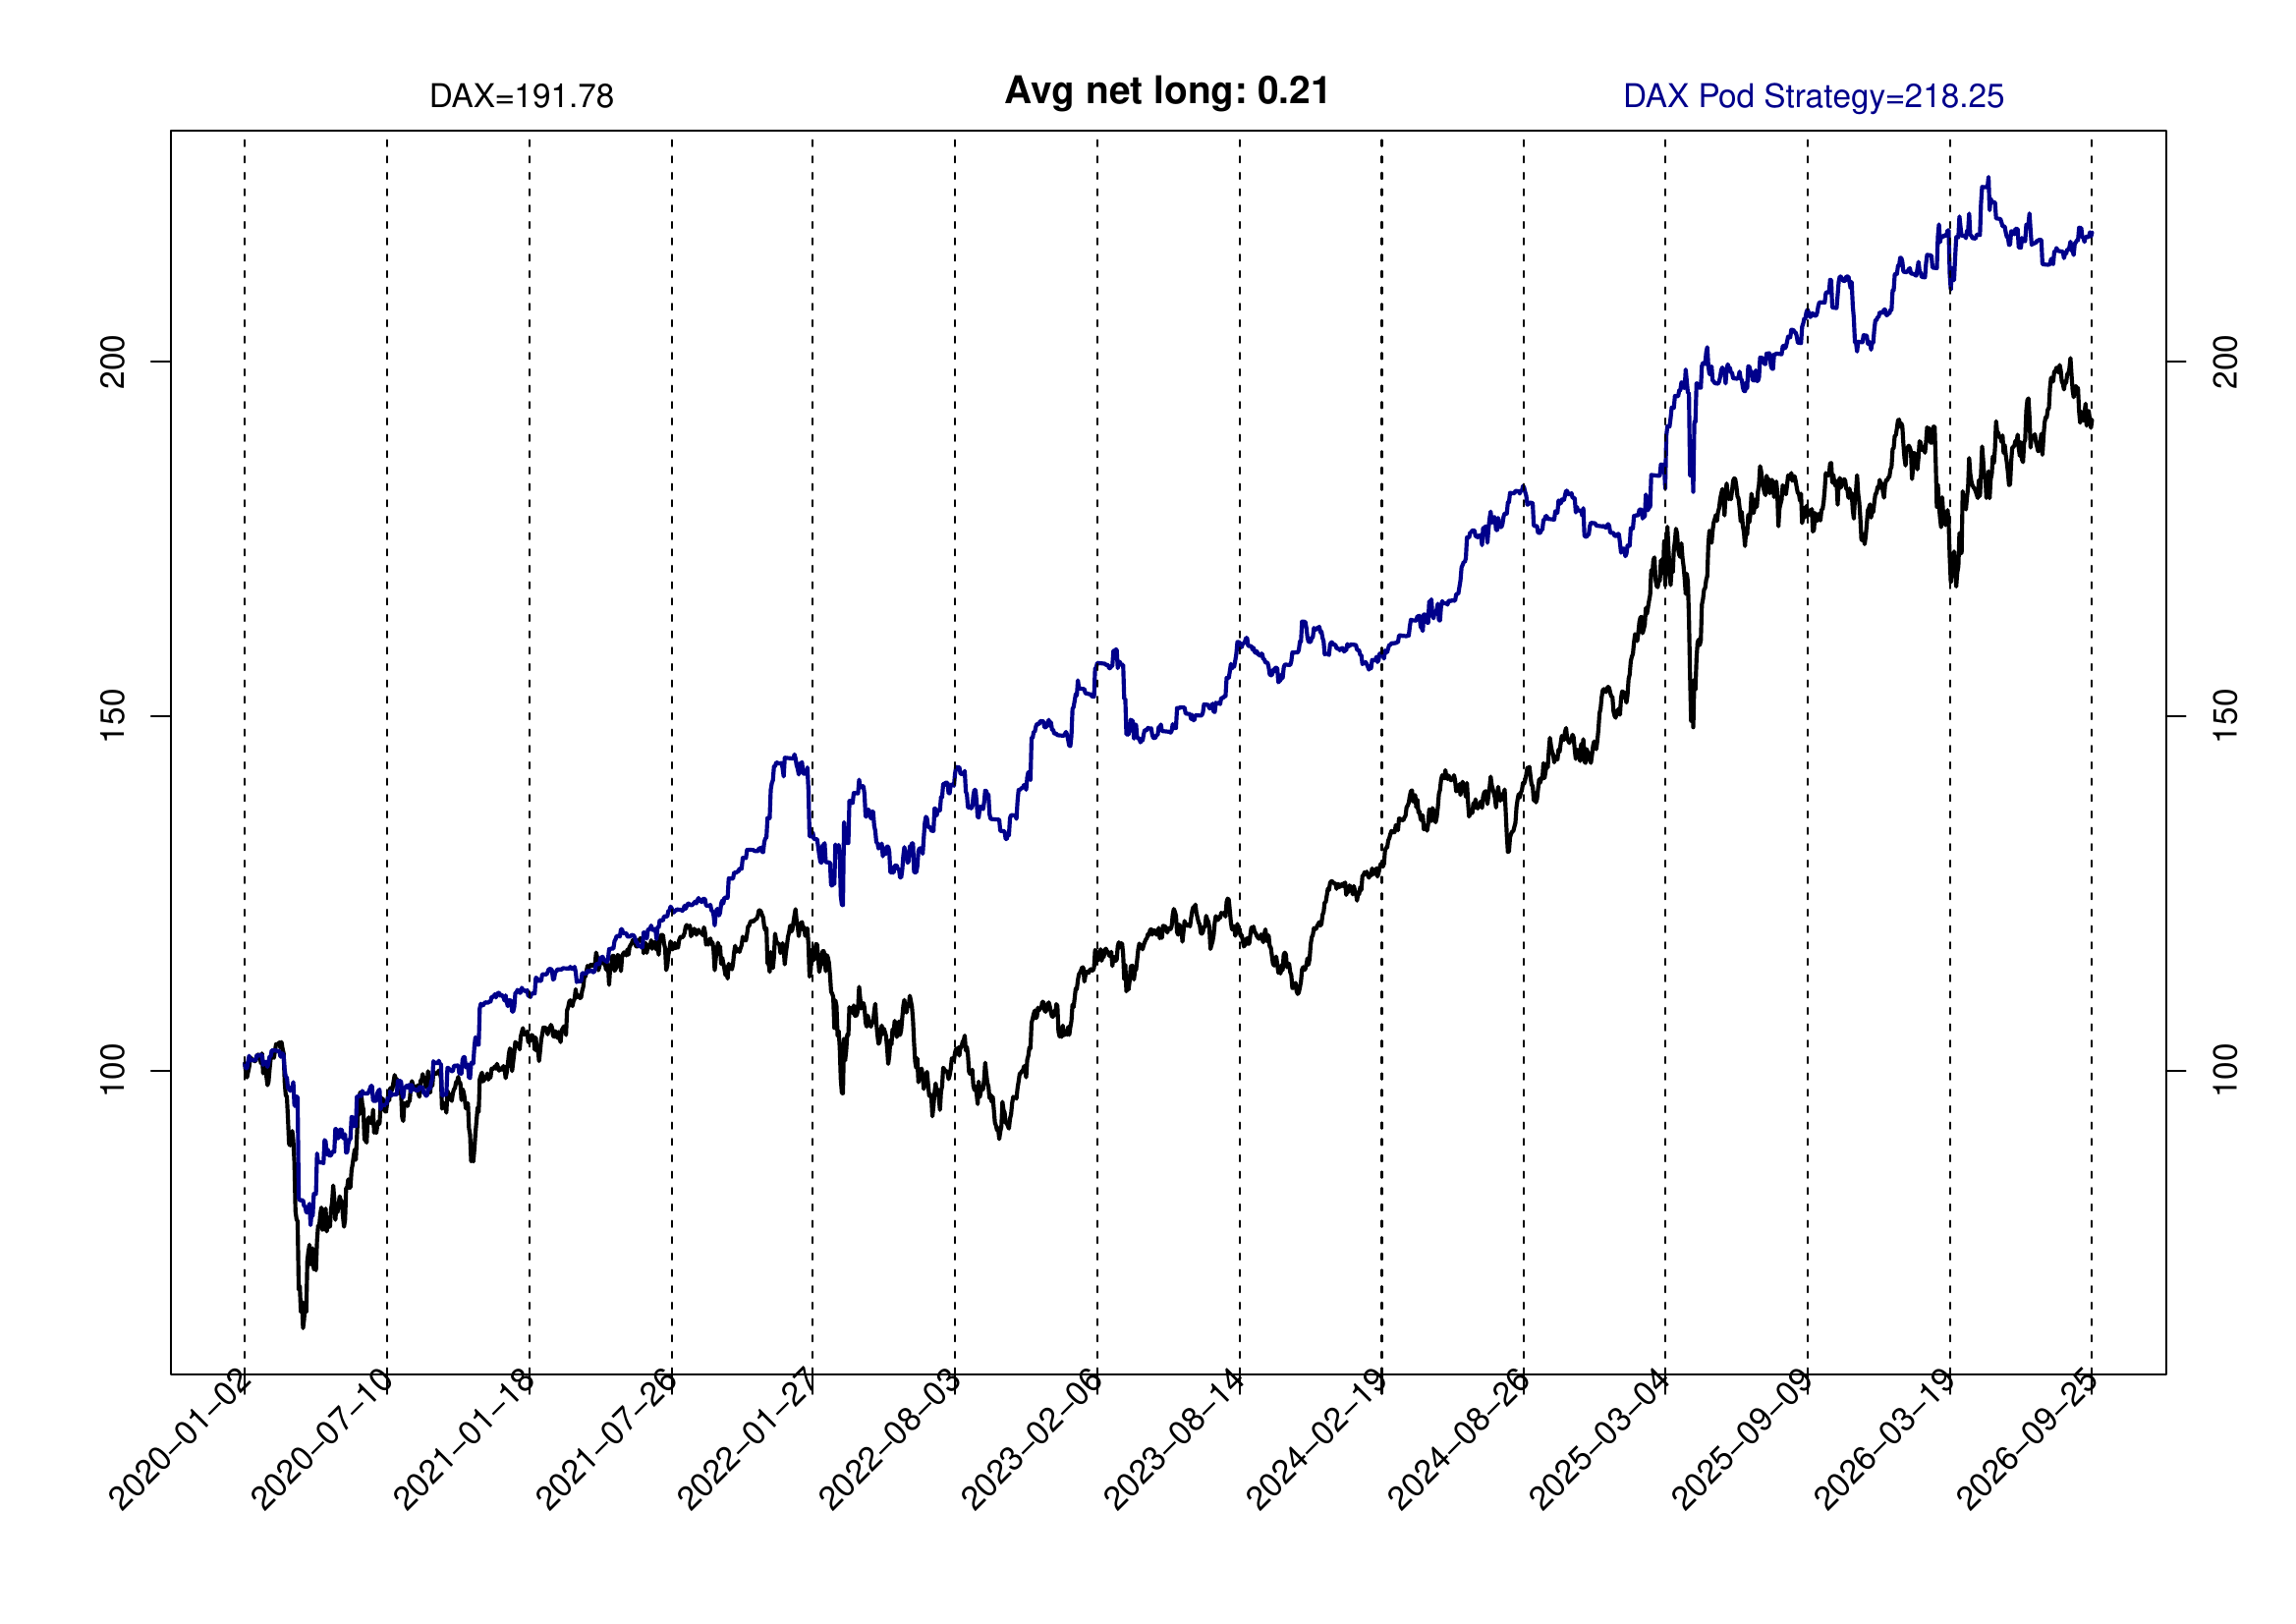
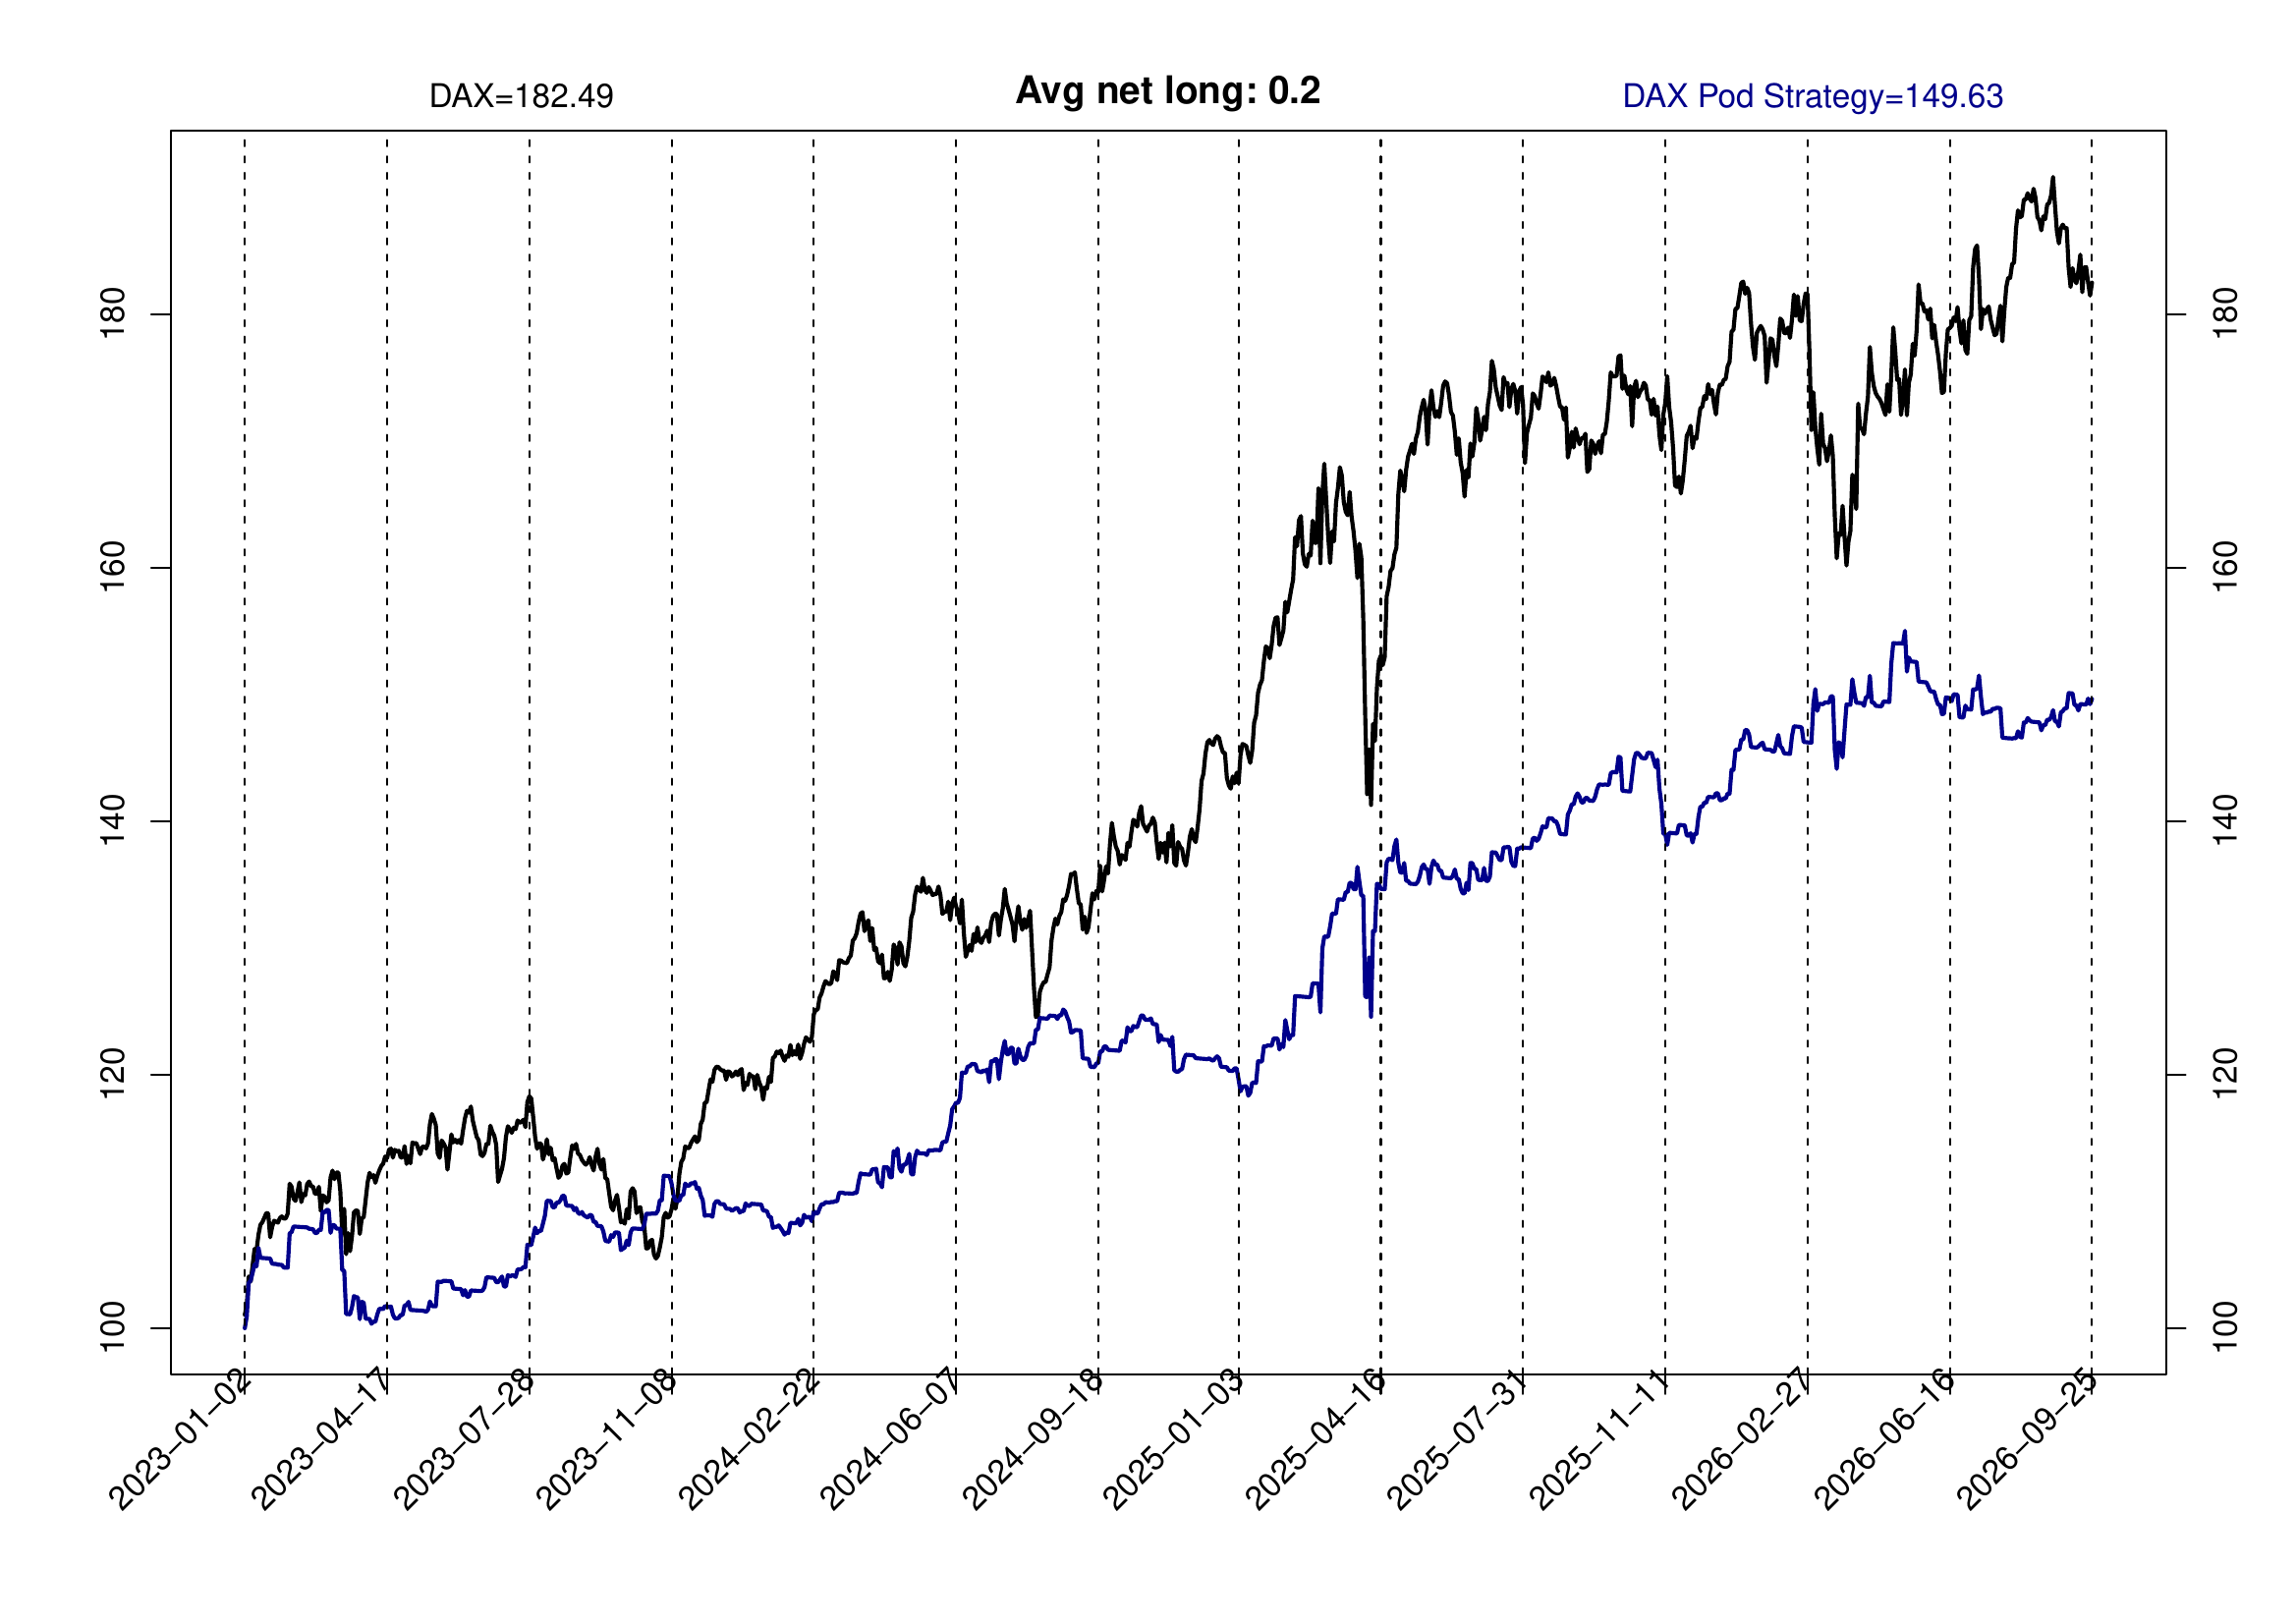
The strategy has been backtested since the year 1960; only the results for the most recent years are presented here. Each chart below follows a notional investment of 100 euros placed on the same starting date in the DAX cash index (black line), used as the benchmark, and in the Pod Strategy (blue line).
All figures shown are net of trading fees. Other fees — management and performance fees, for example — are excluded.
| Period | DAX cash index | Pod Strategy | Avg net long |
|---|
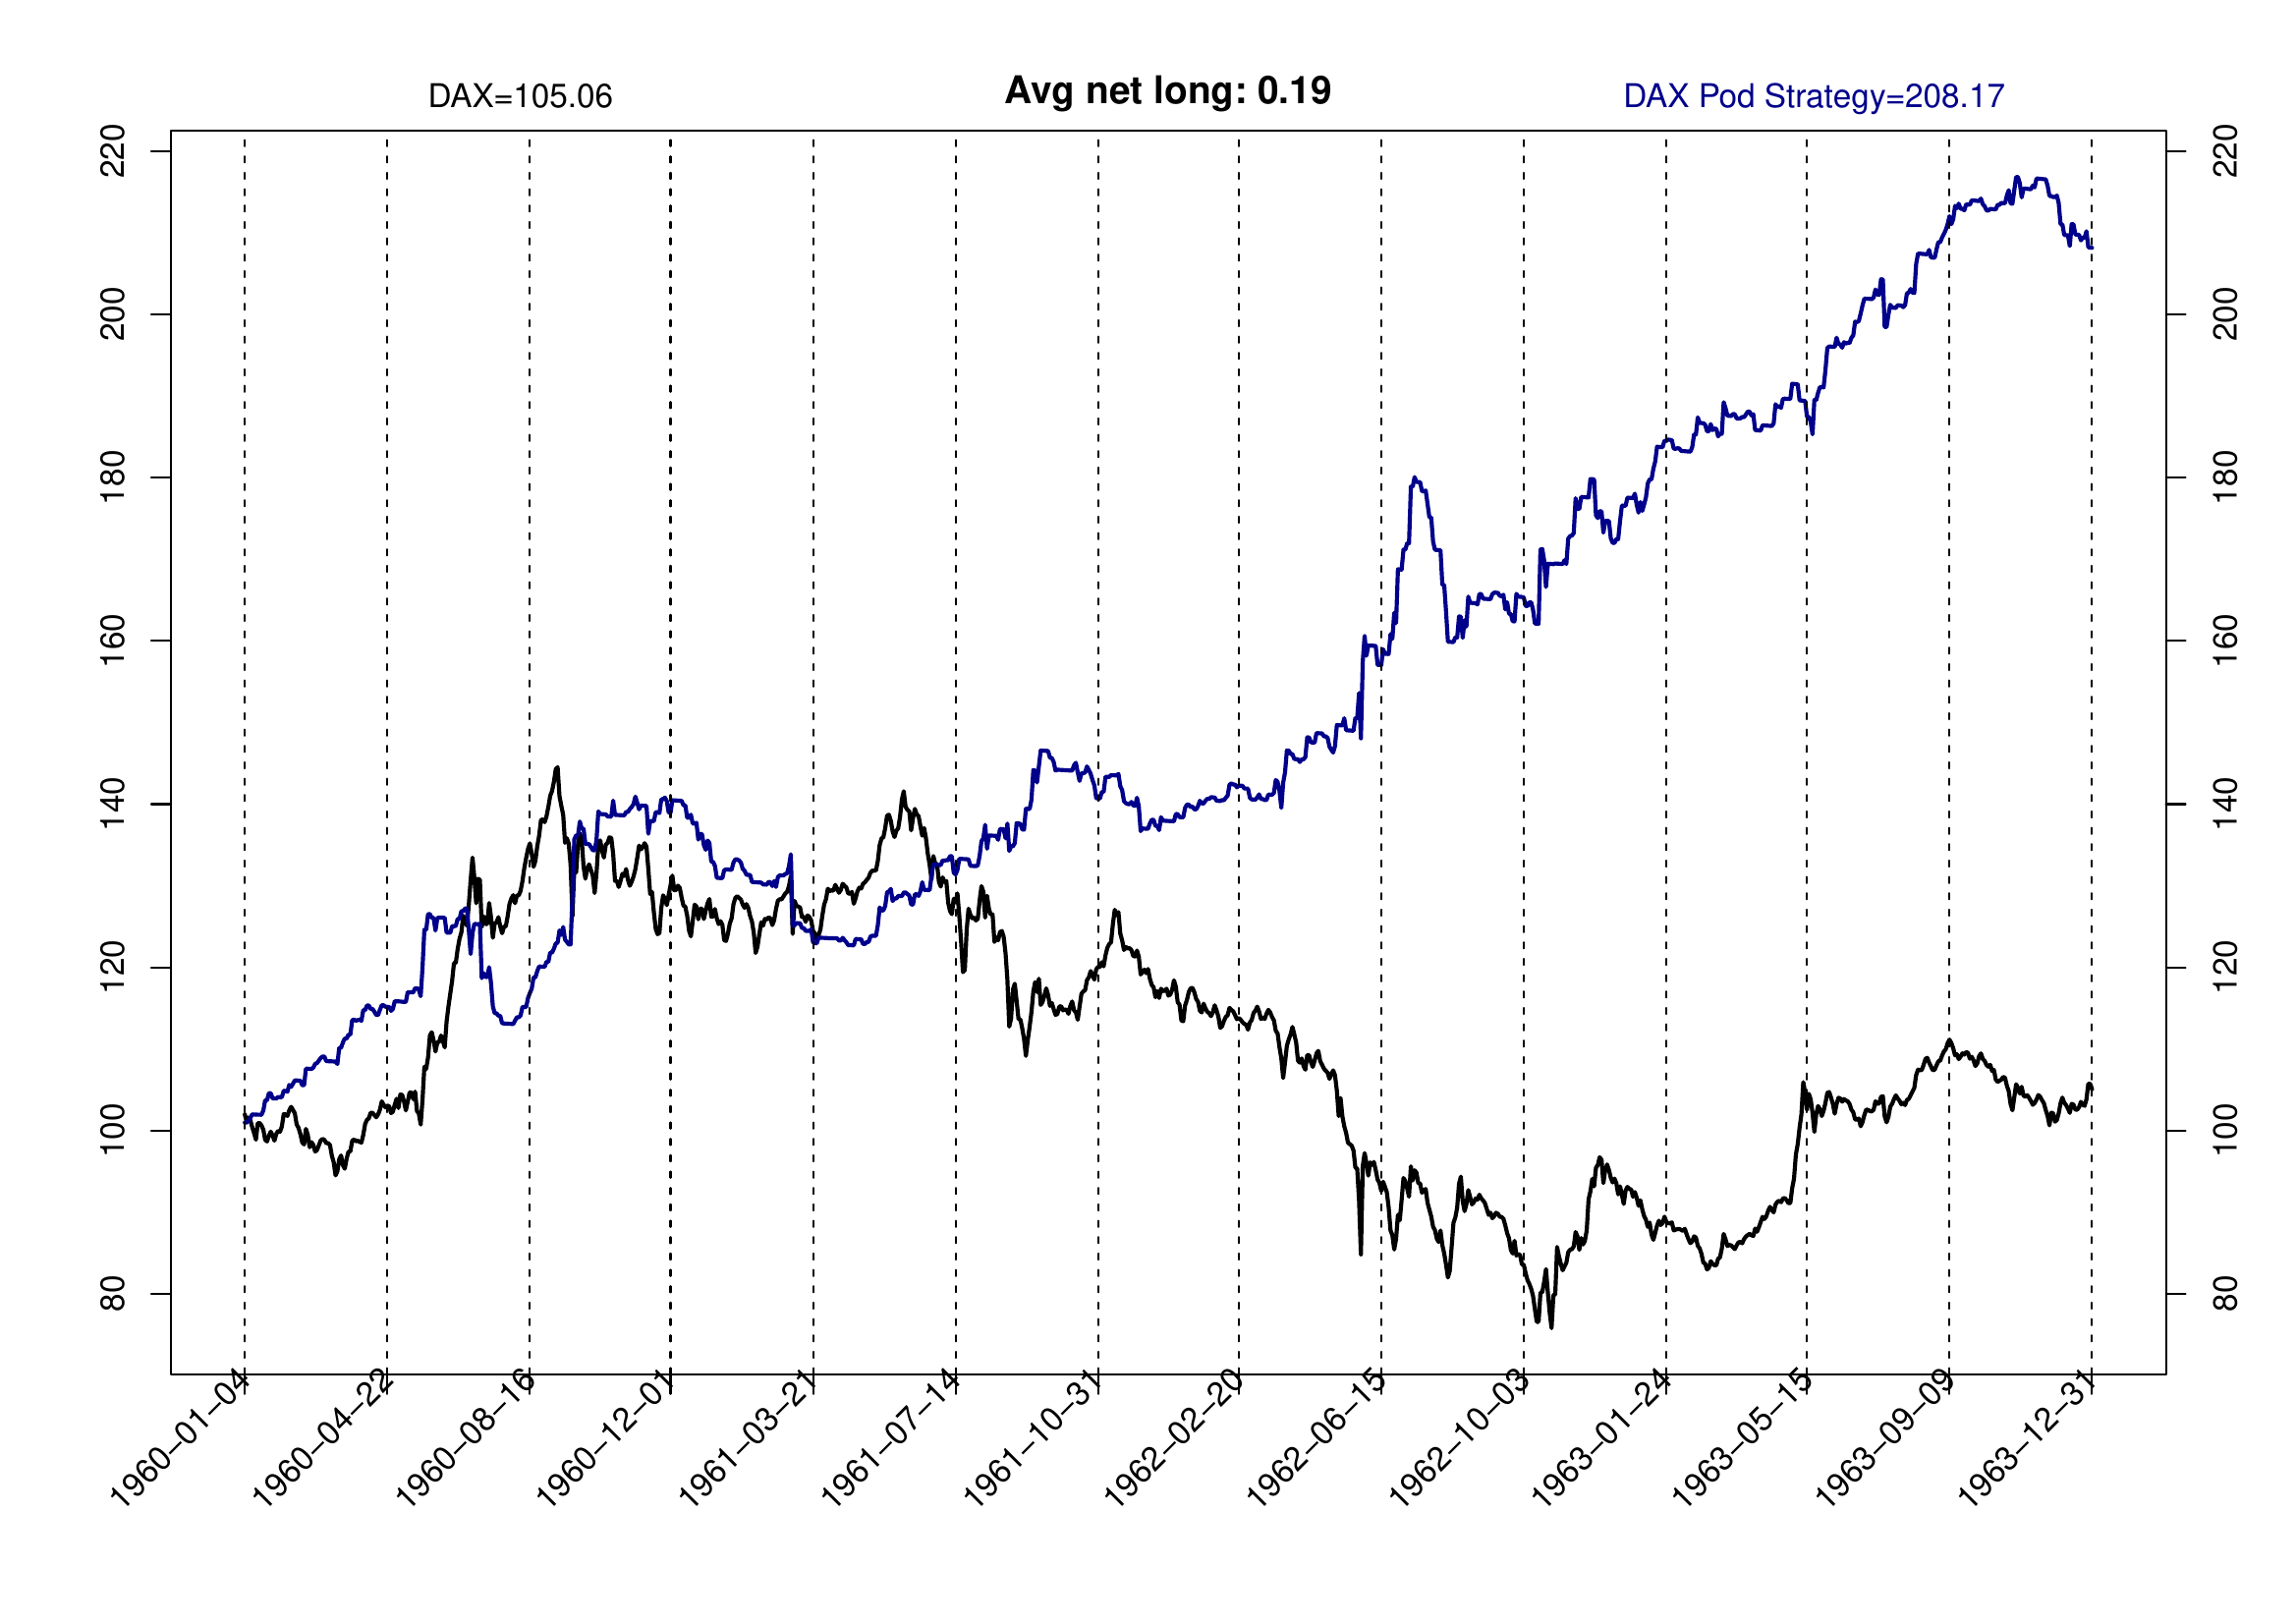
| 1960 – 1963 (appendix) | 105.06 | 208.17 | 0.19 |
| 2007 – 2009 (3 years) | 90.31 | 305.38 | 0.22 |
| 2010 – 25 Sep 2026 | 426.5 | 1173.37 | 0.22 |
| 2020 – 25 Sep 2026 | 191.78 | 218.25 | 0.21 |
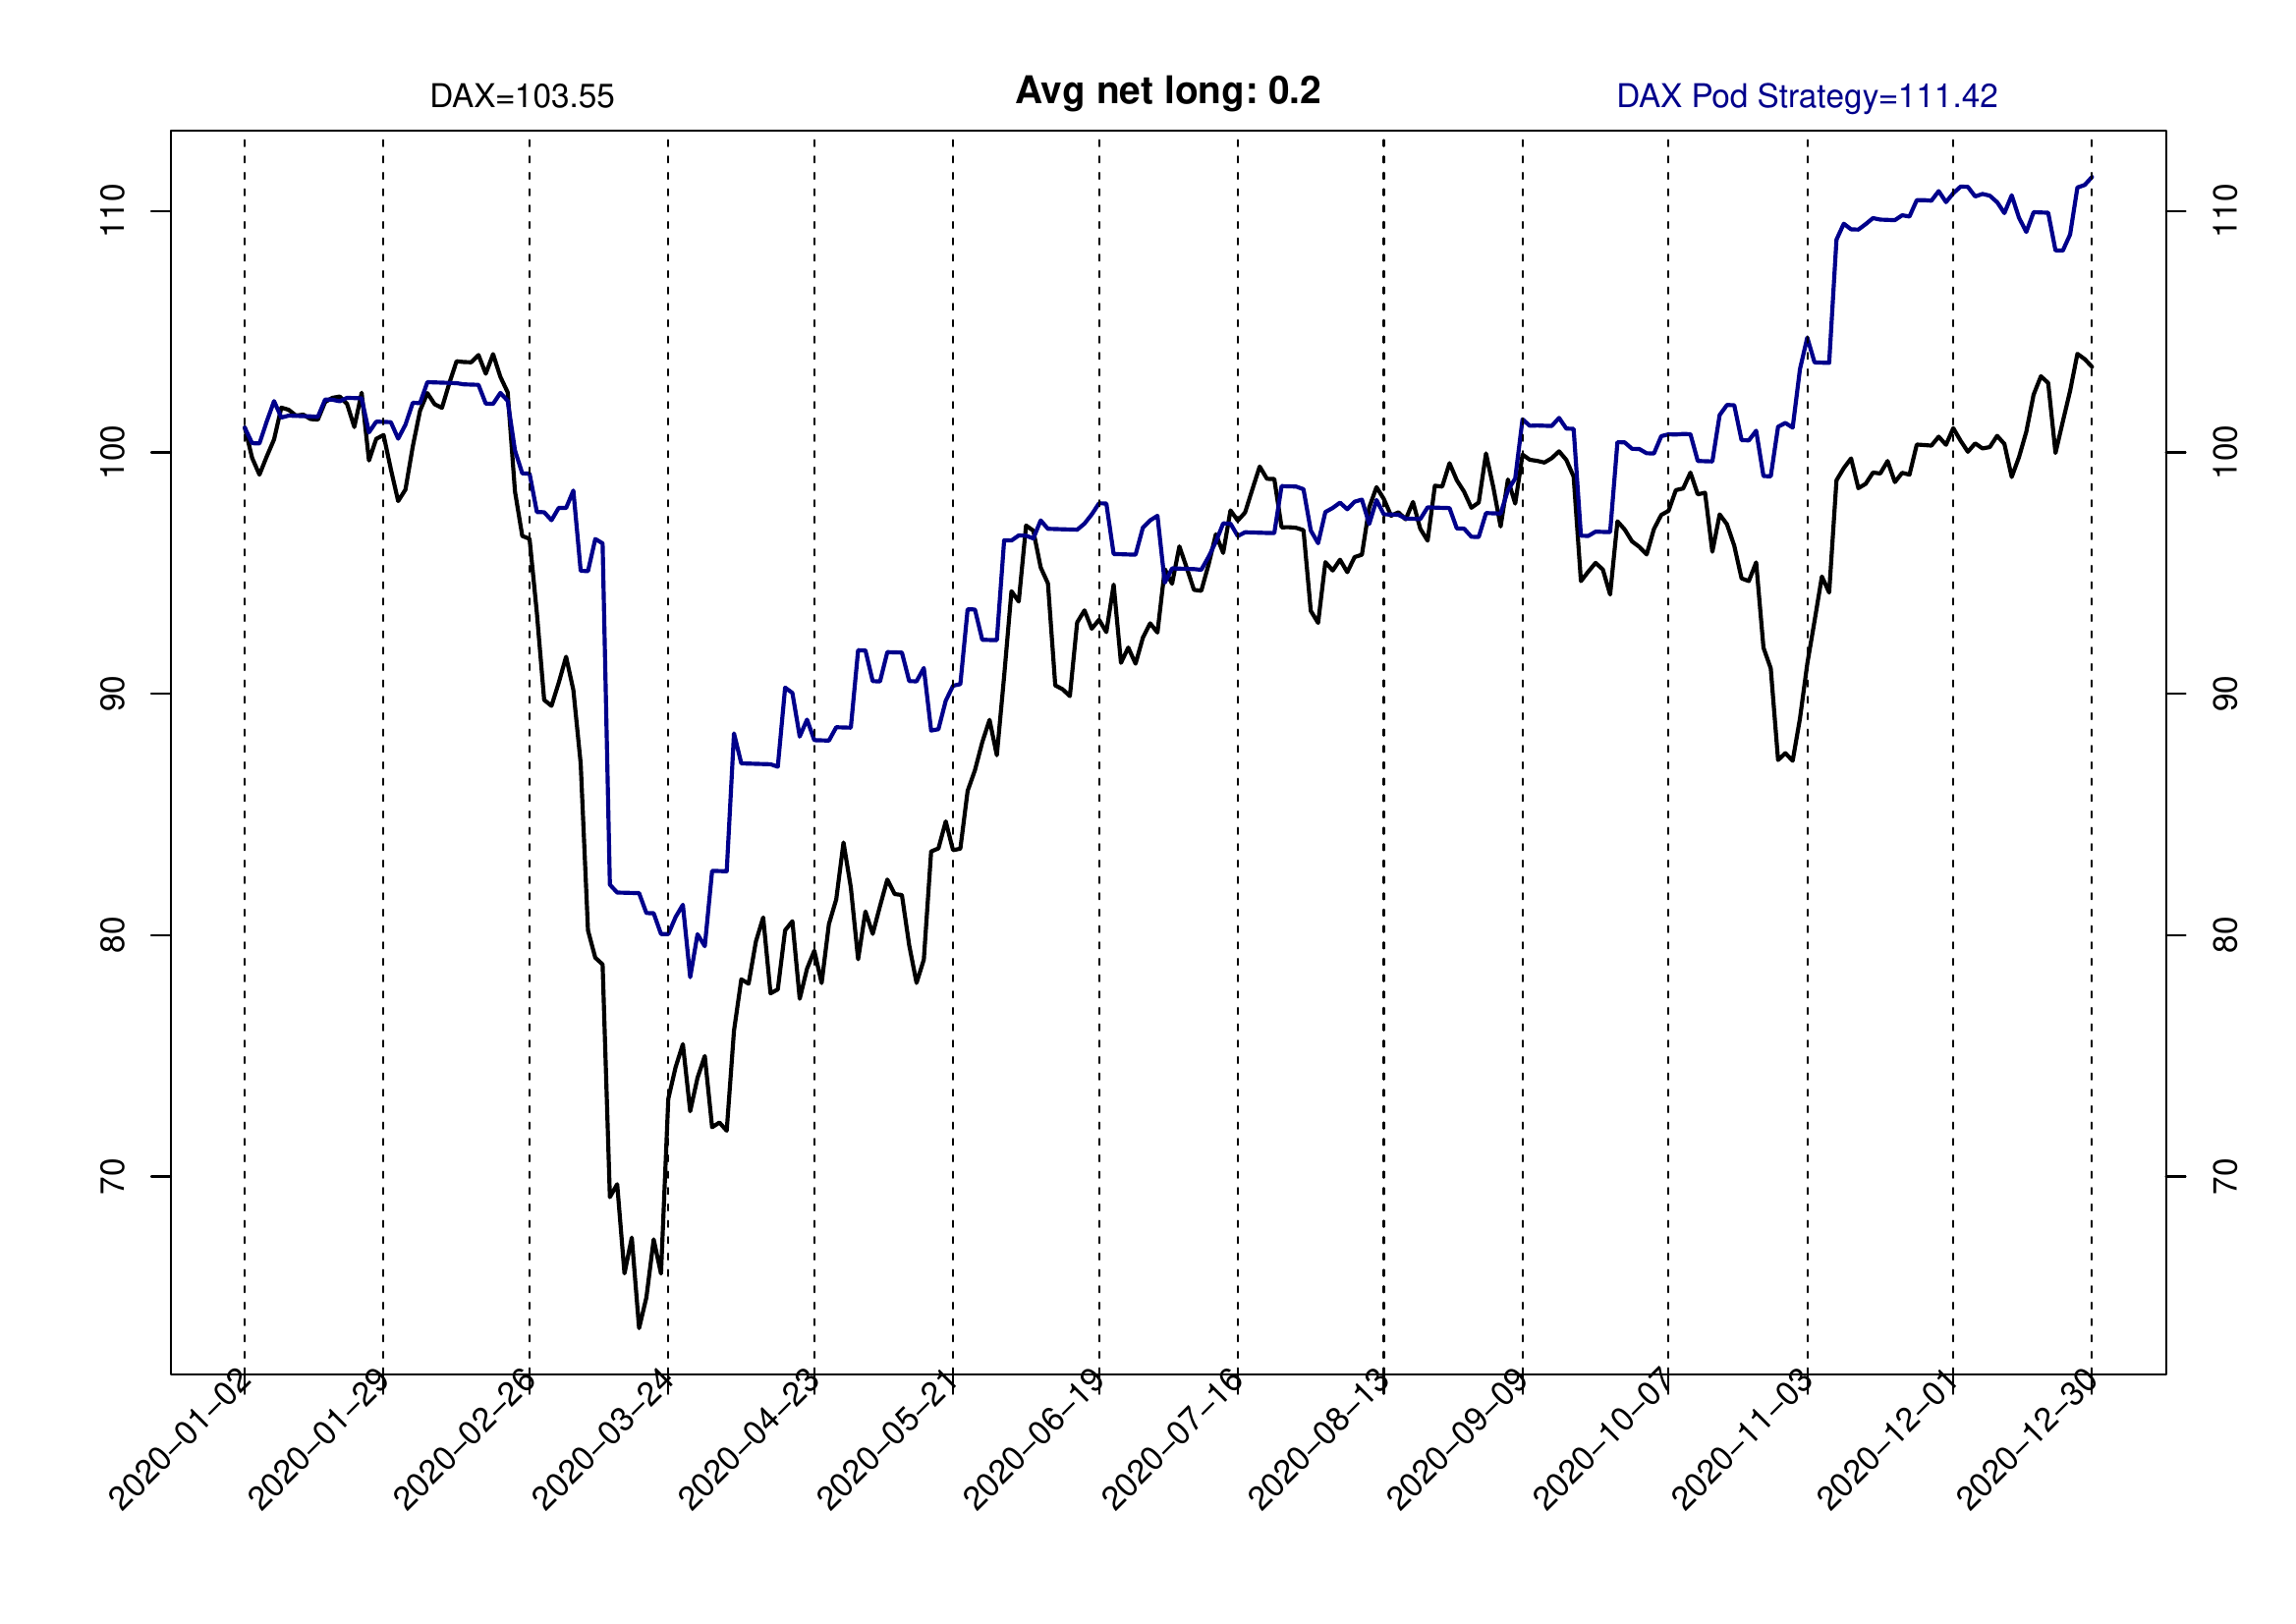
| 2020 (calendar year, appendix) | 103.55 | 111.42 | 0.20 |
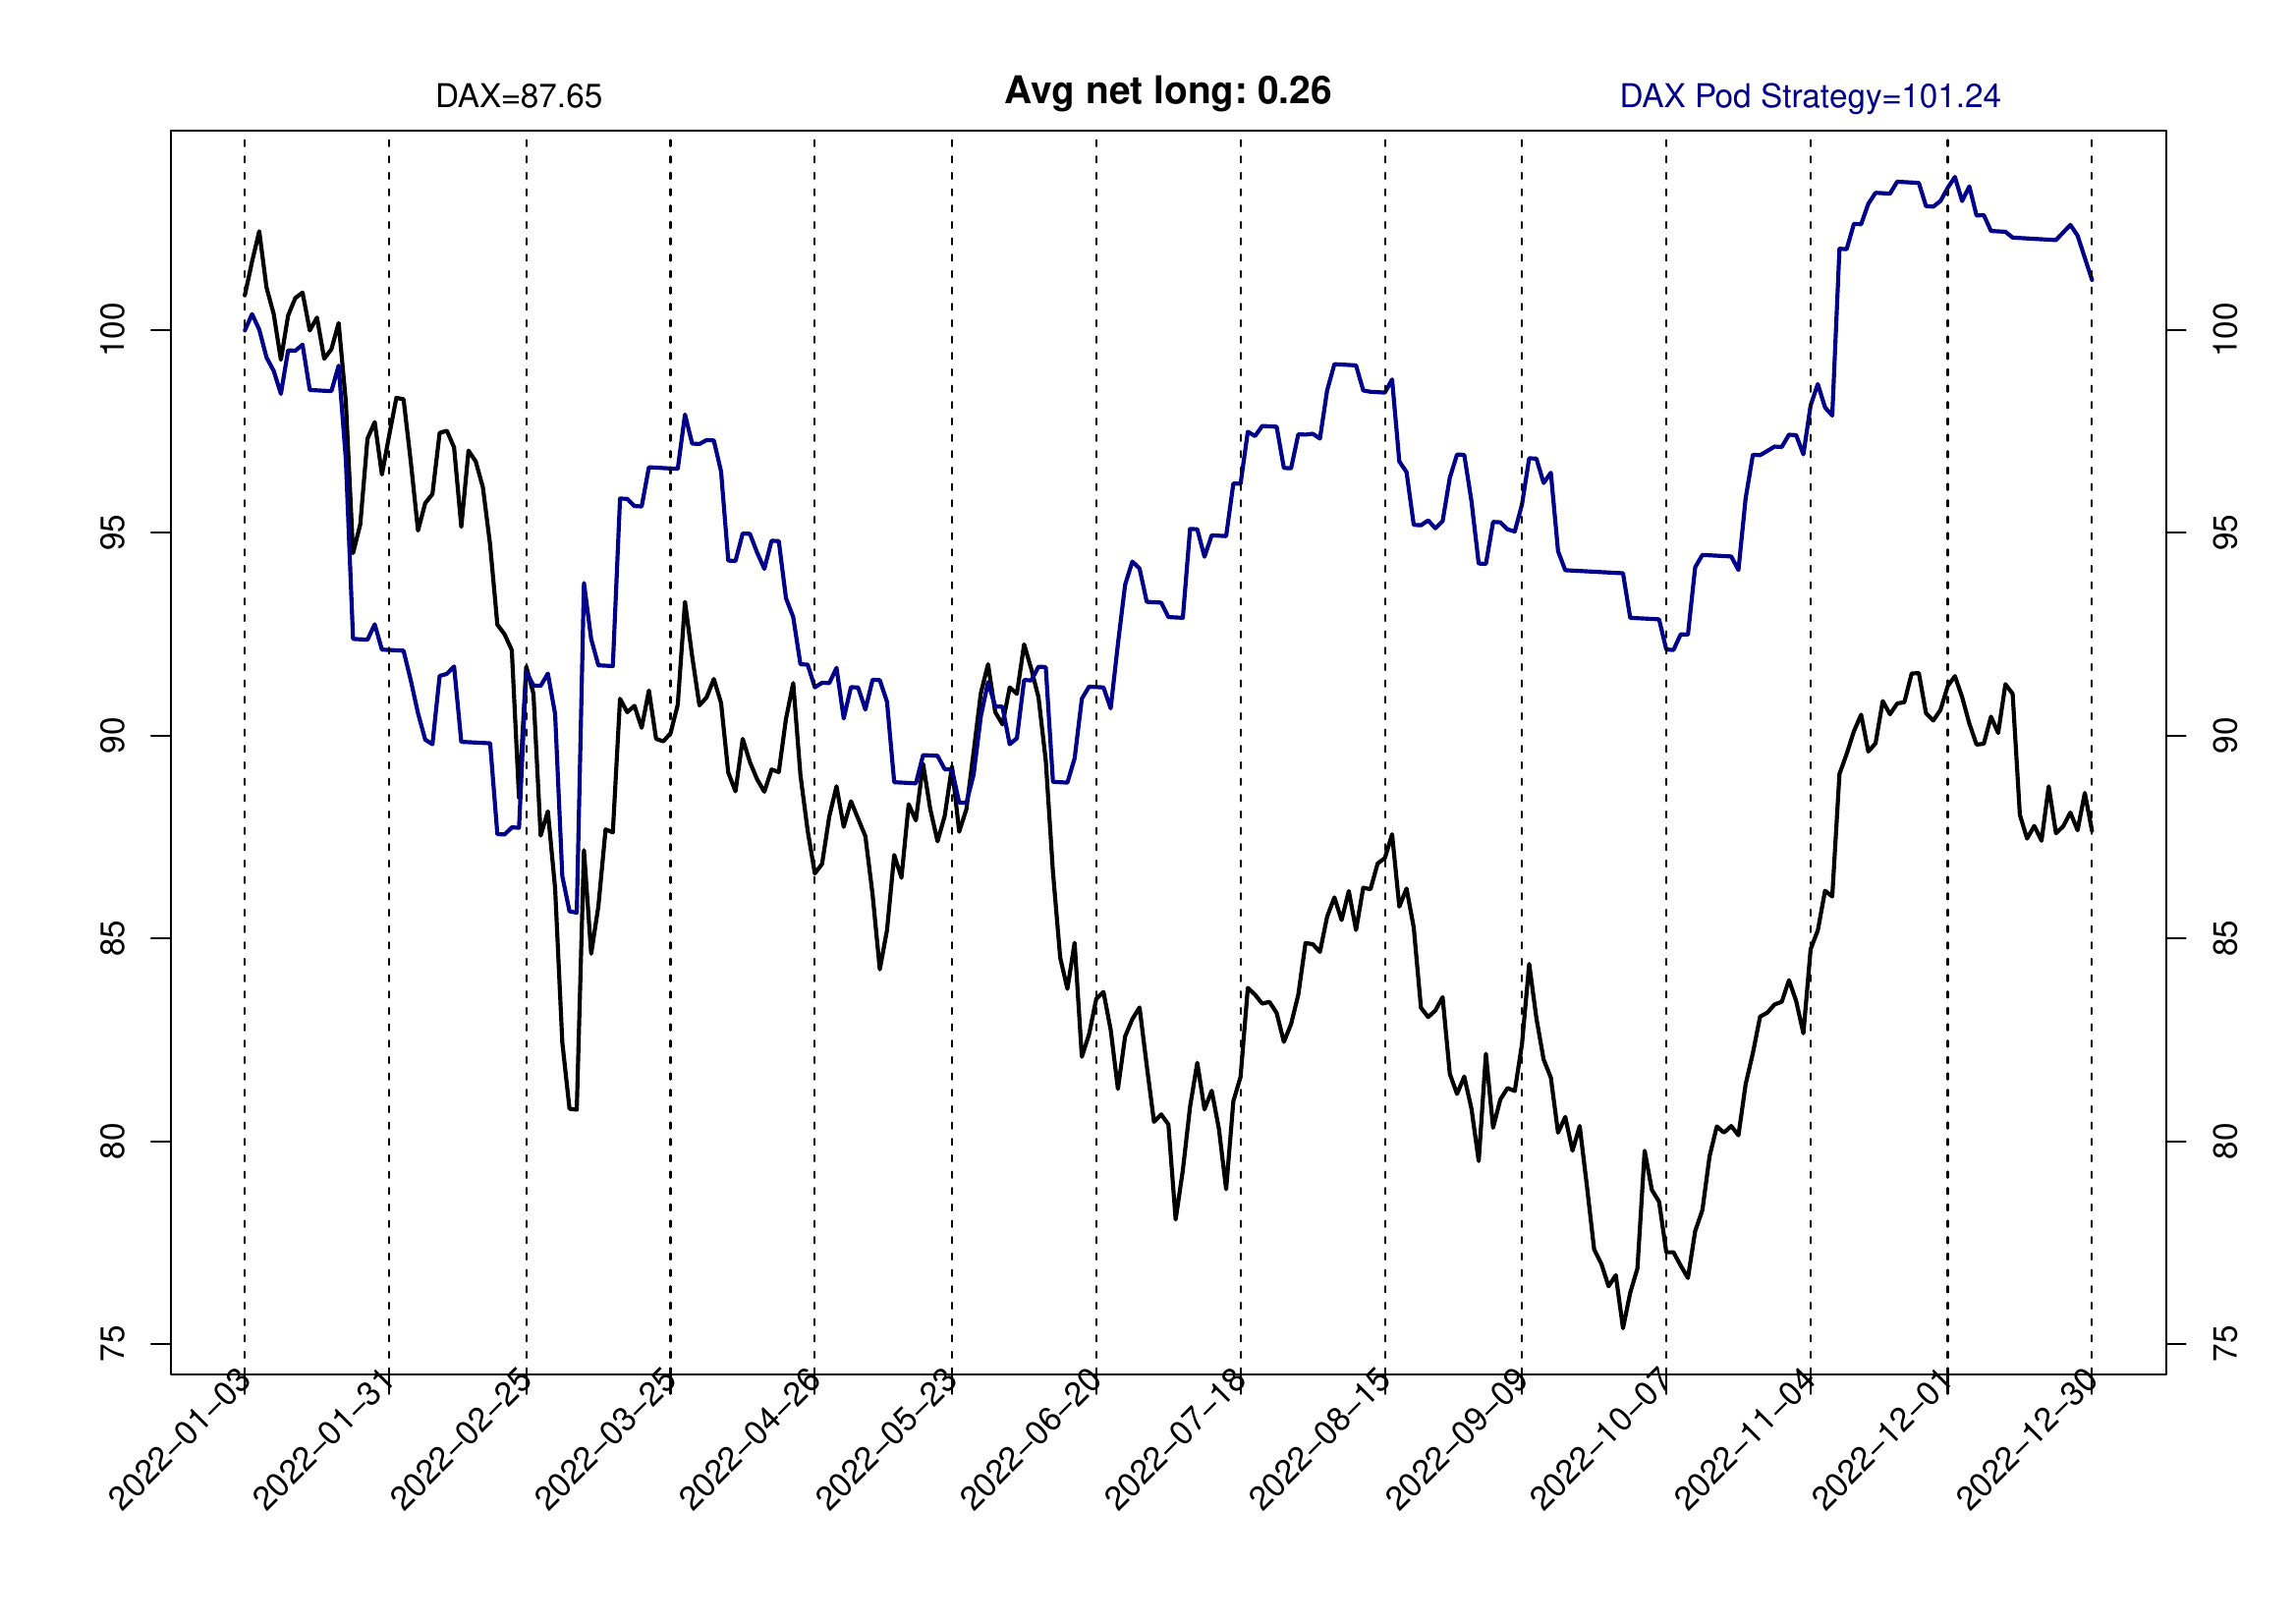
| 2022 (calendar year, appendix) | 87.65 | 101.24 | 0.26 |
| 2023 – 25 Sep 2026 | 182.49 | 149.63 | 0.20 |
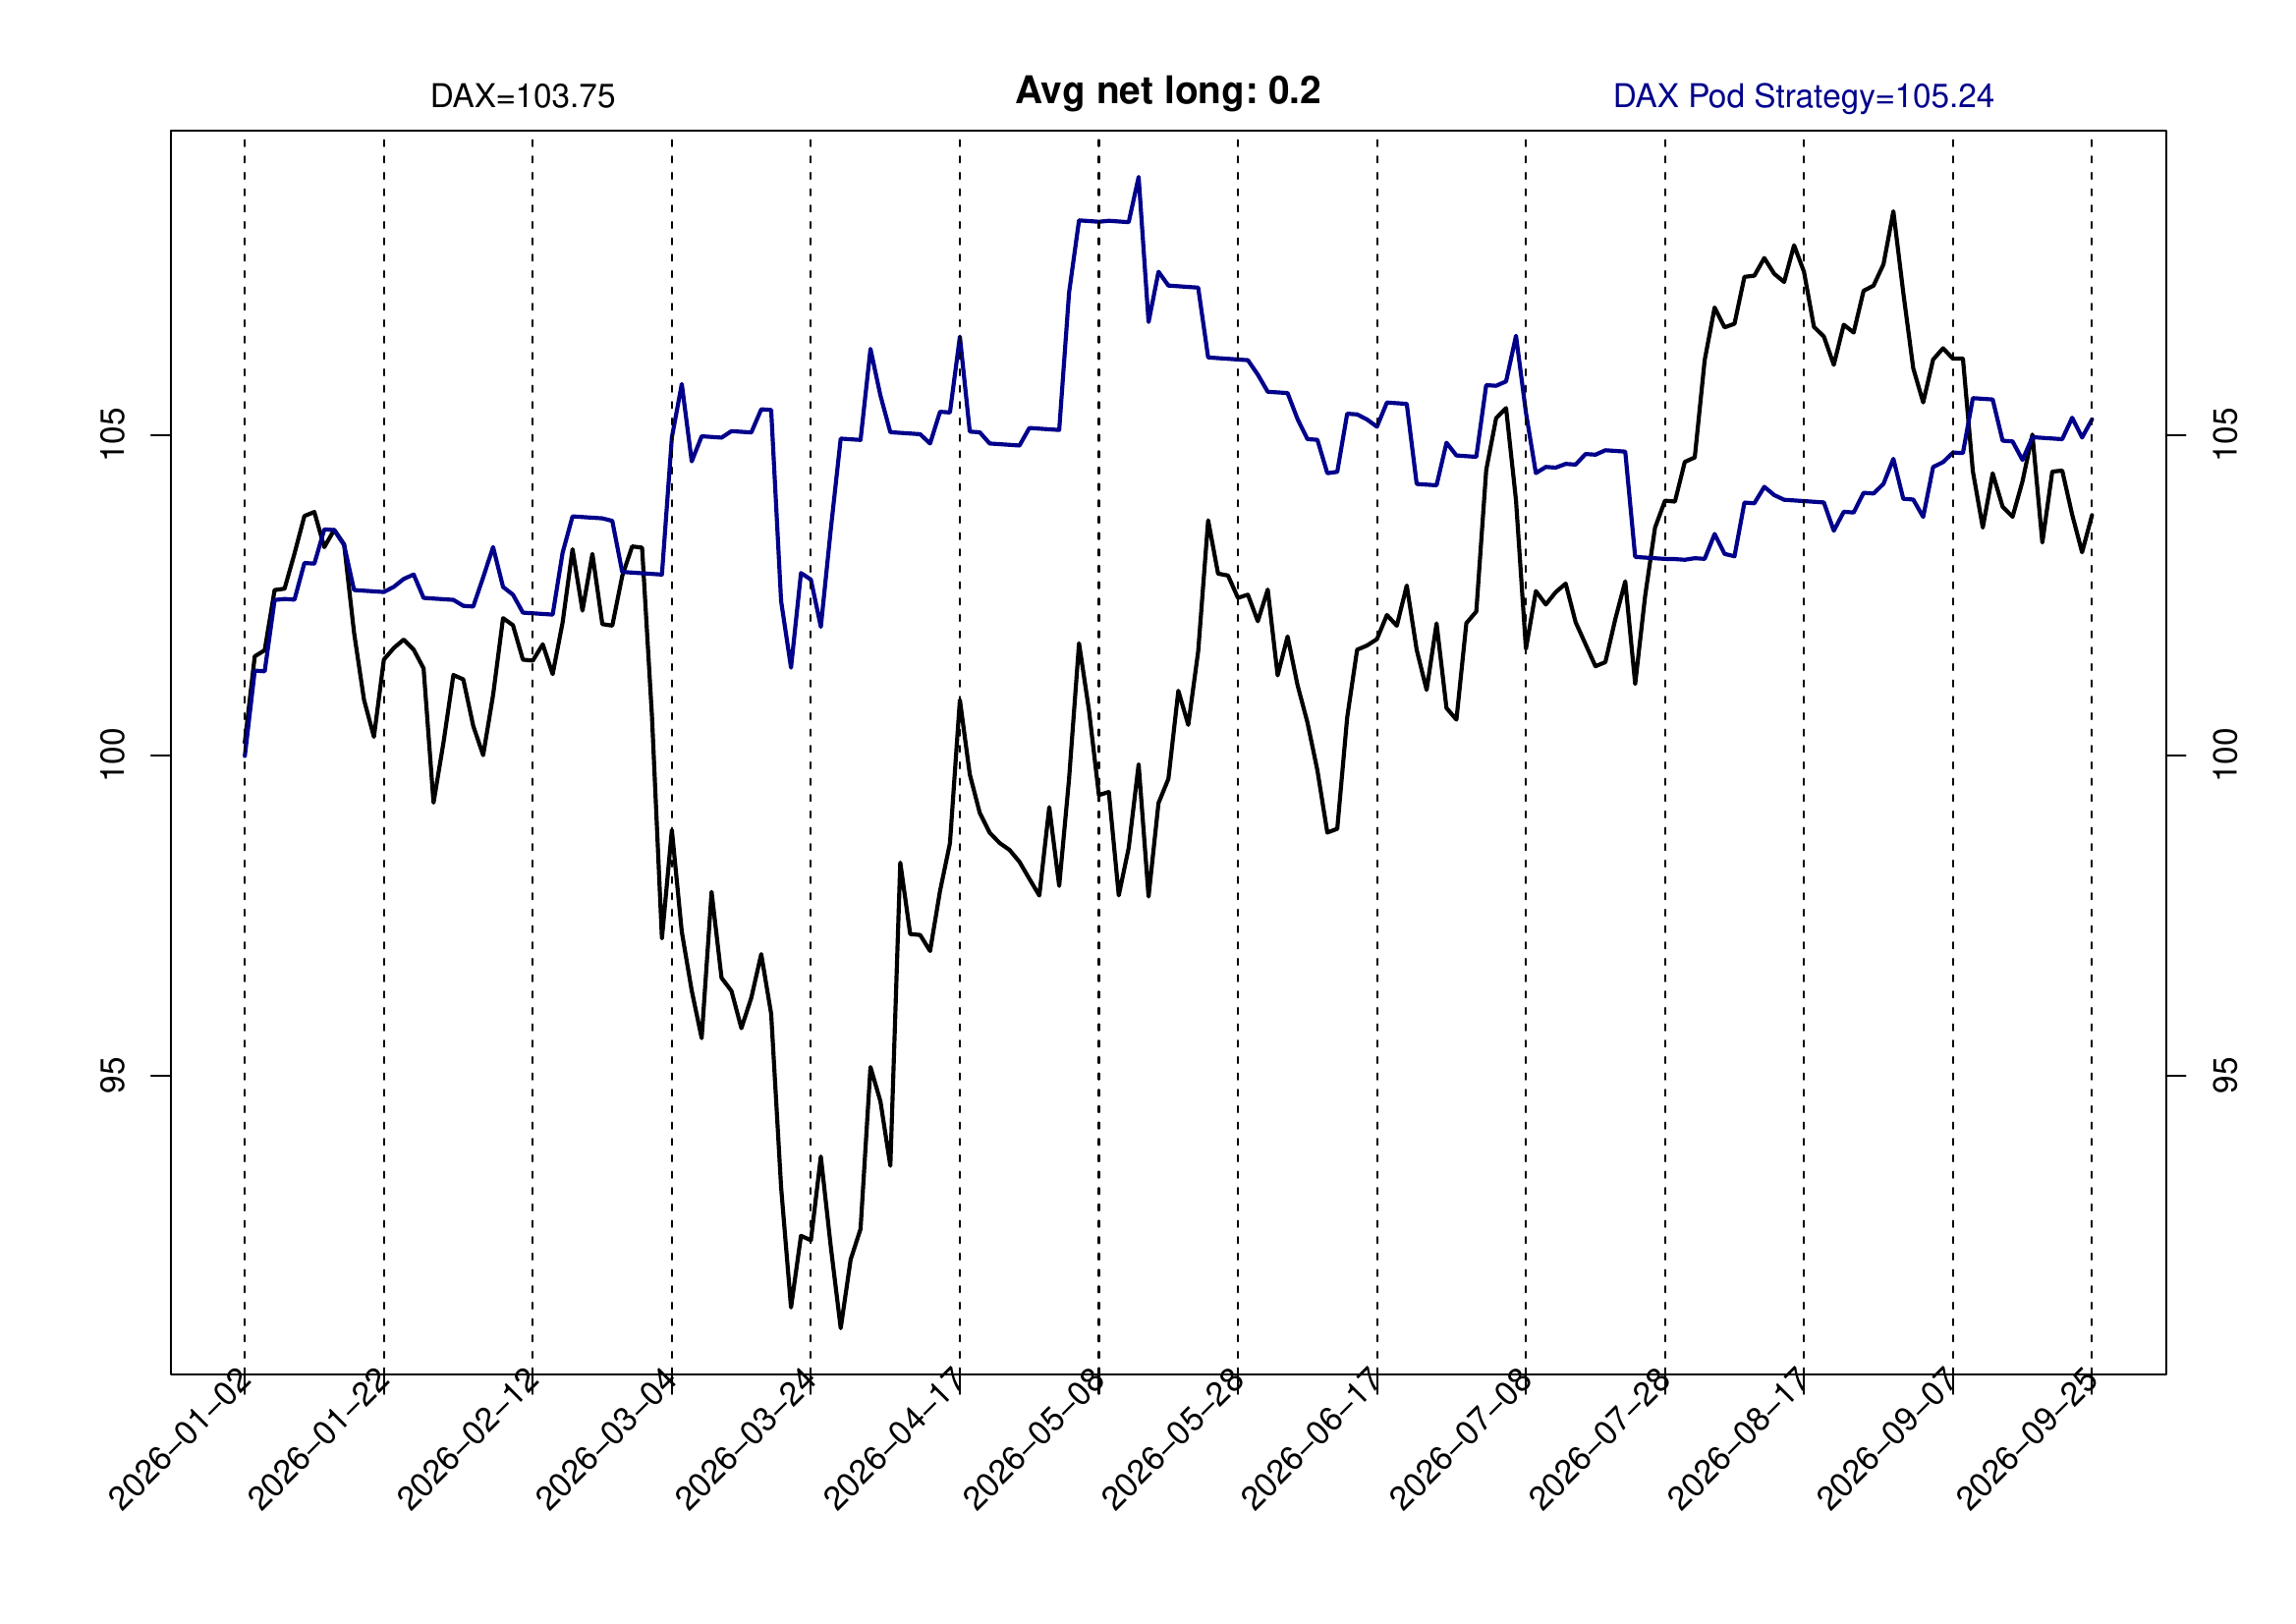
| 2026 – 25 Sep 2026 | 103.75 | 105.24 | 0.20 |
End-of-period values for a notional 100 euros invested at the start of each period. Avg net long is the average net exposure of the strategy over the period. See the charts below for the full track record of each window.
Backtested results are presented as observations only. They are not guarantees of future outcomes, and nothing on this page constitutes a recommendation to deal in any instrument or transaction.
2007–2009: three years through the financial crisis
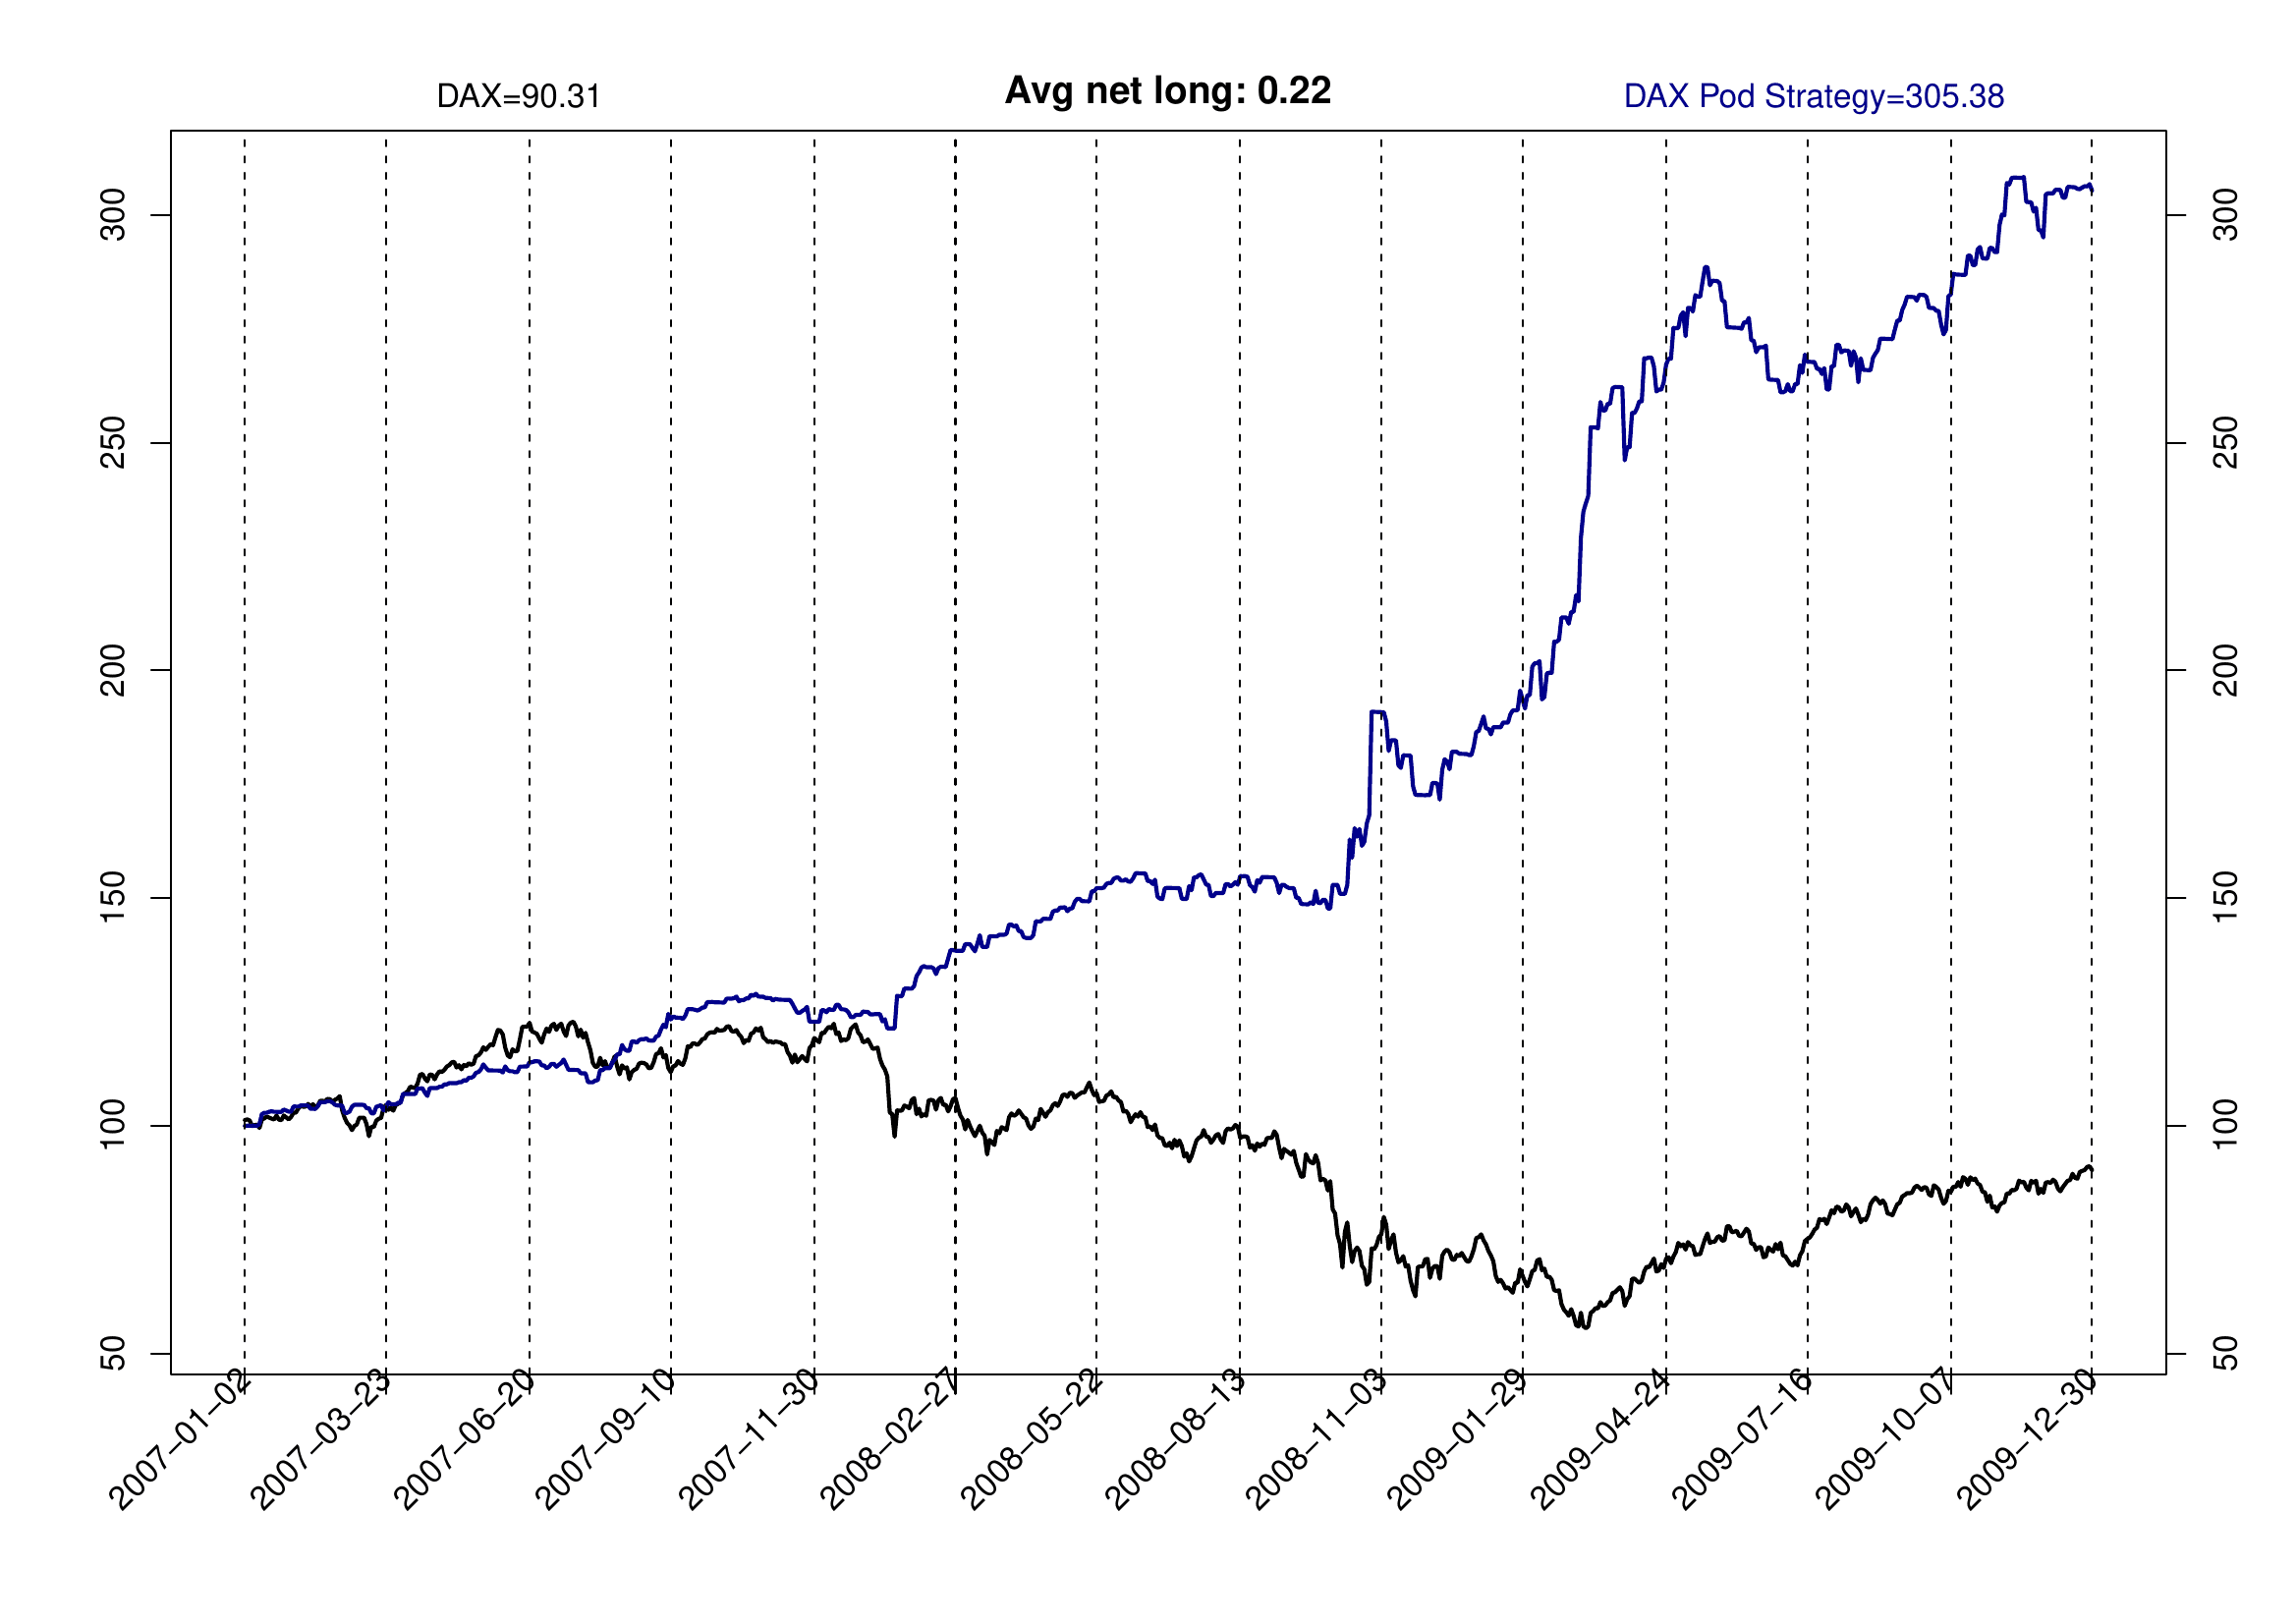
The first chart follows an investor who commits 100 euros at the beginning of 2007 and remains invested for a period of three years, through the global financial crisis. By the end of 2009 the same 100 euros held in the DAX cash index had fallen back to 90.31, while the Pod Strategy stood at 305.38. The strategy ran an average net exposure of 0.22 over the period, against a benchmark that remained 100% net long throughout.
Black line: DAX cash index benchmark. Blue line: DAX Pod Strategy. Click the chart to open it full size in a separate tab.
From 1 January 2010 to end-September 2026
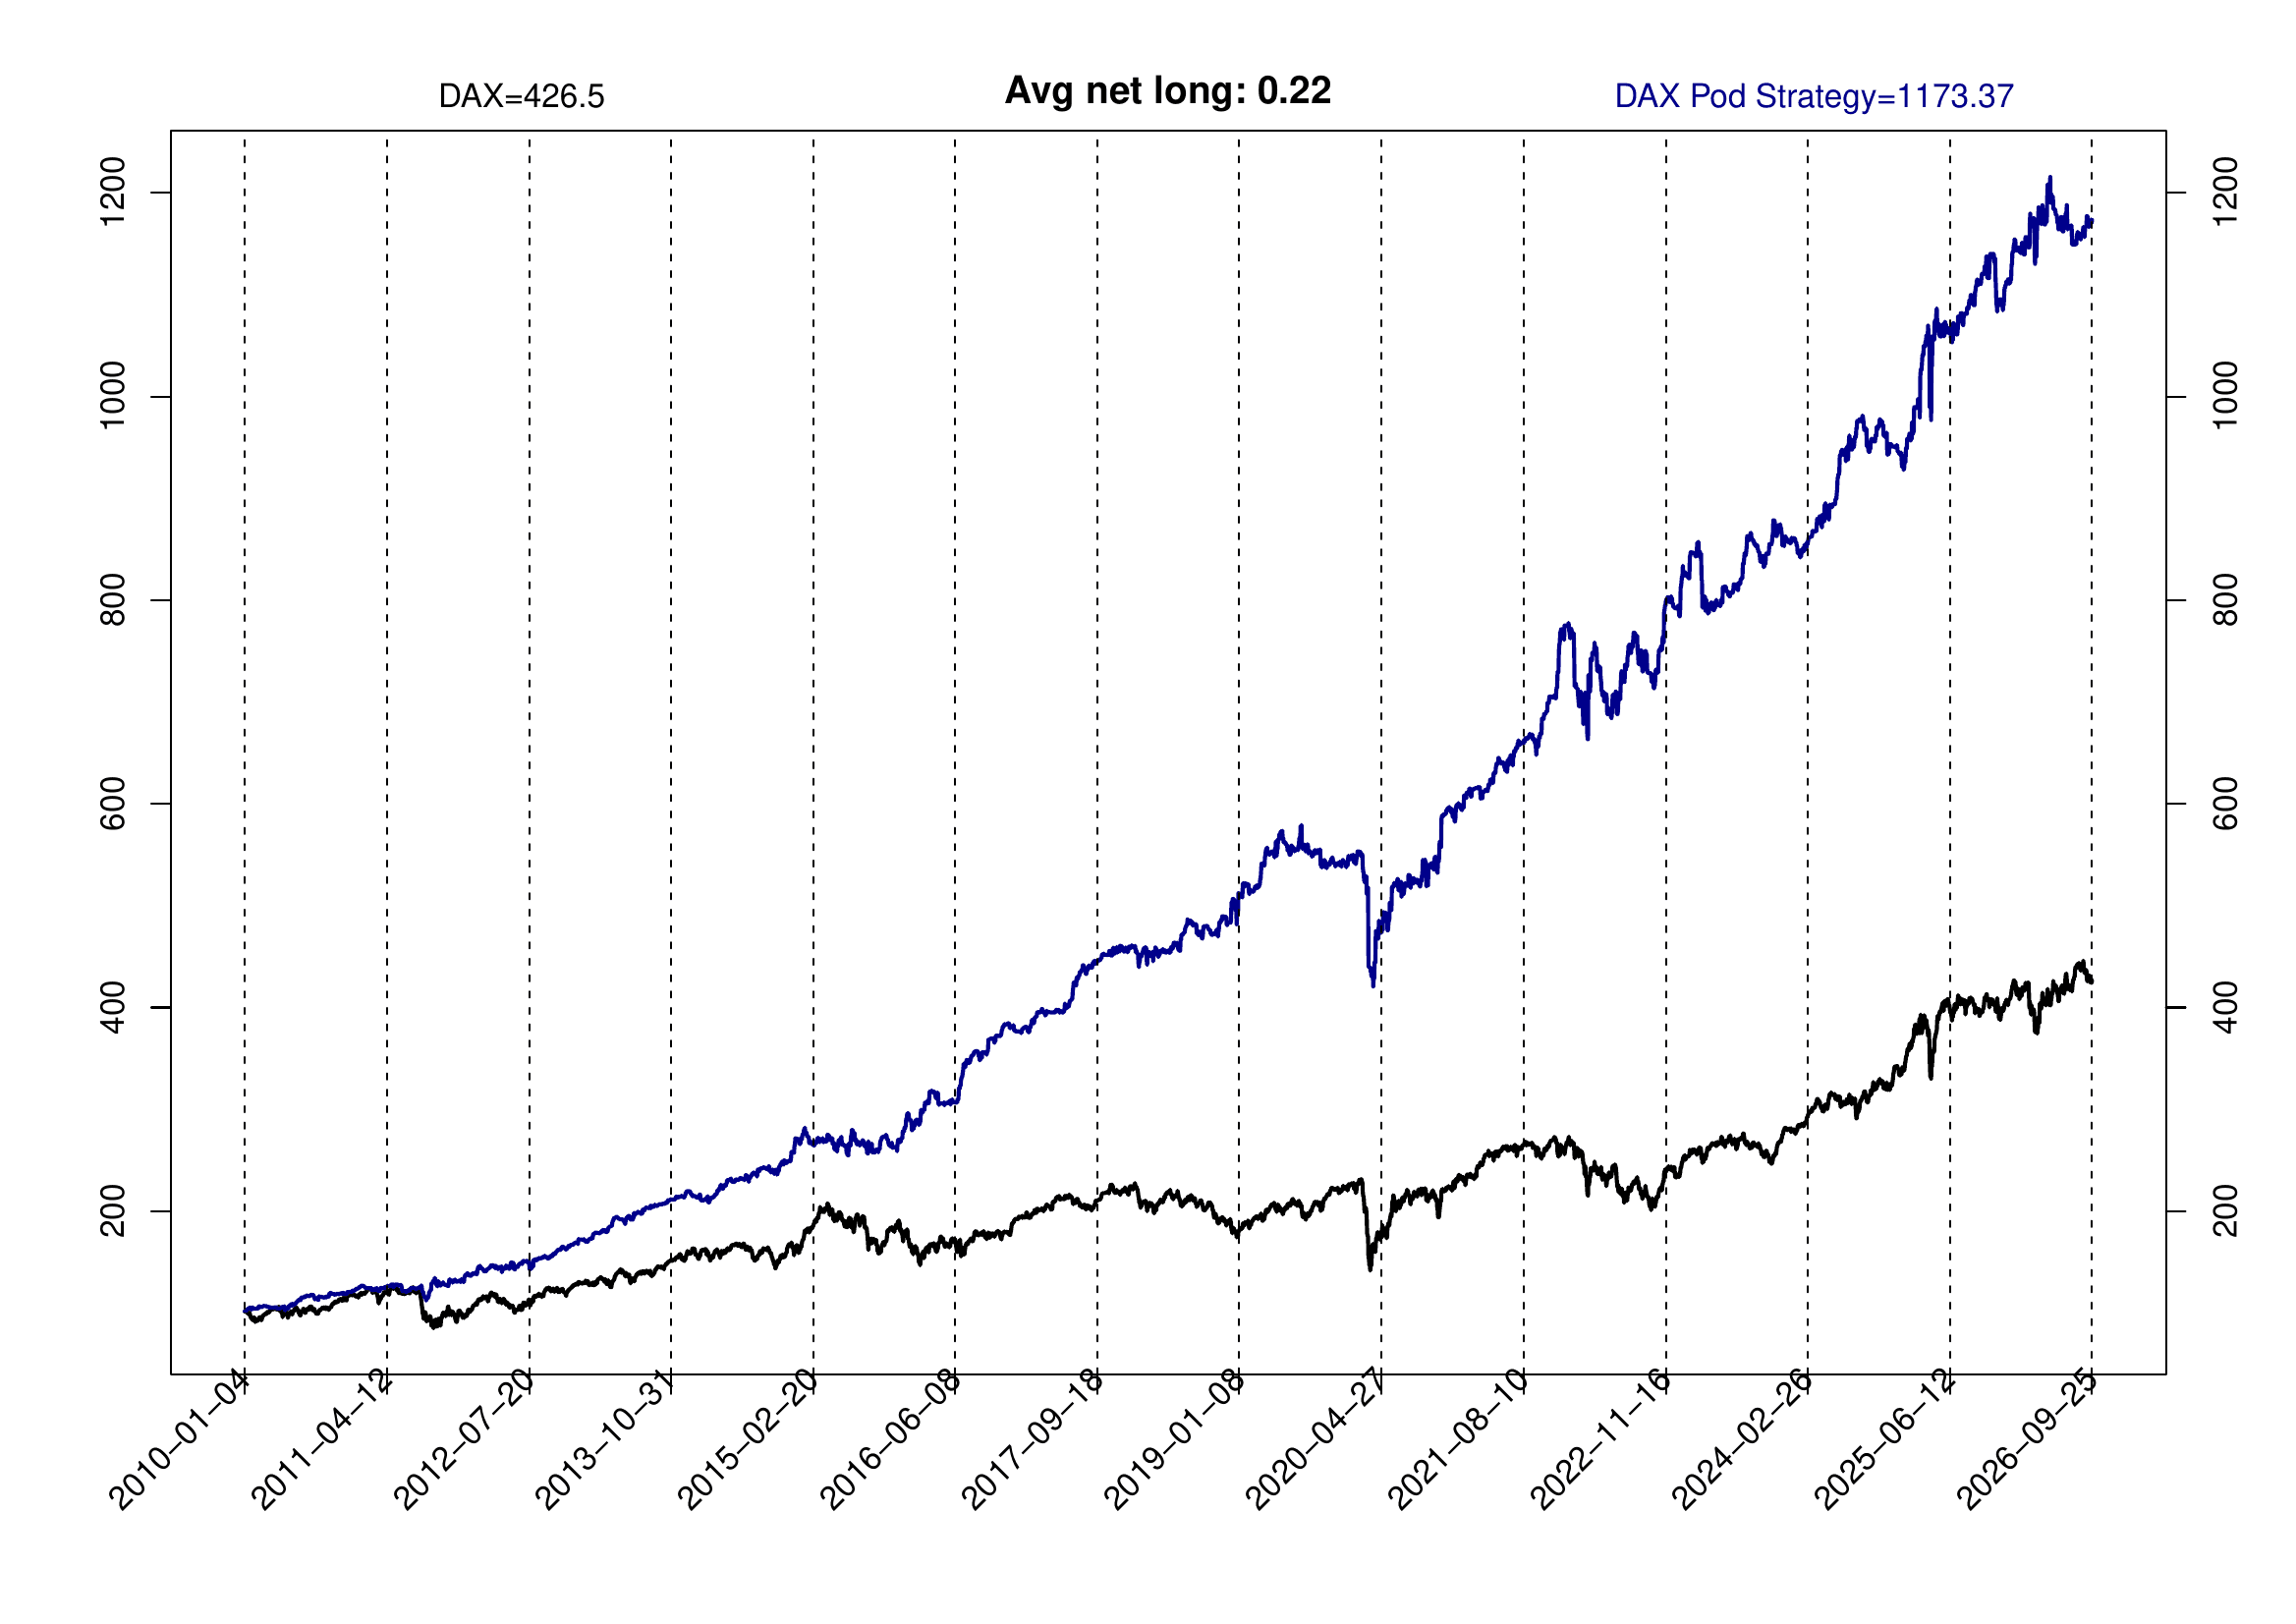
The second chart follows an investor who started with 100 euros on 1 January 2010 and remained invested through to end-September 2026. Over that span the DAX cash index grew the initial 100 euros to 426.5, while the Pod Strategy reached 1173.37, with an average net exposure of 0.22 over the period.
Black line: DAX cash index benchmark. Blue line: DAX Pod Strategy. Click the chart to open it full size in a separate tab.
From 1 January 2020 to end-September 2026
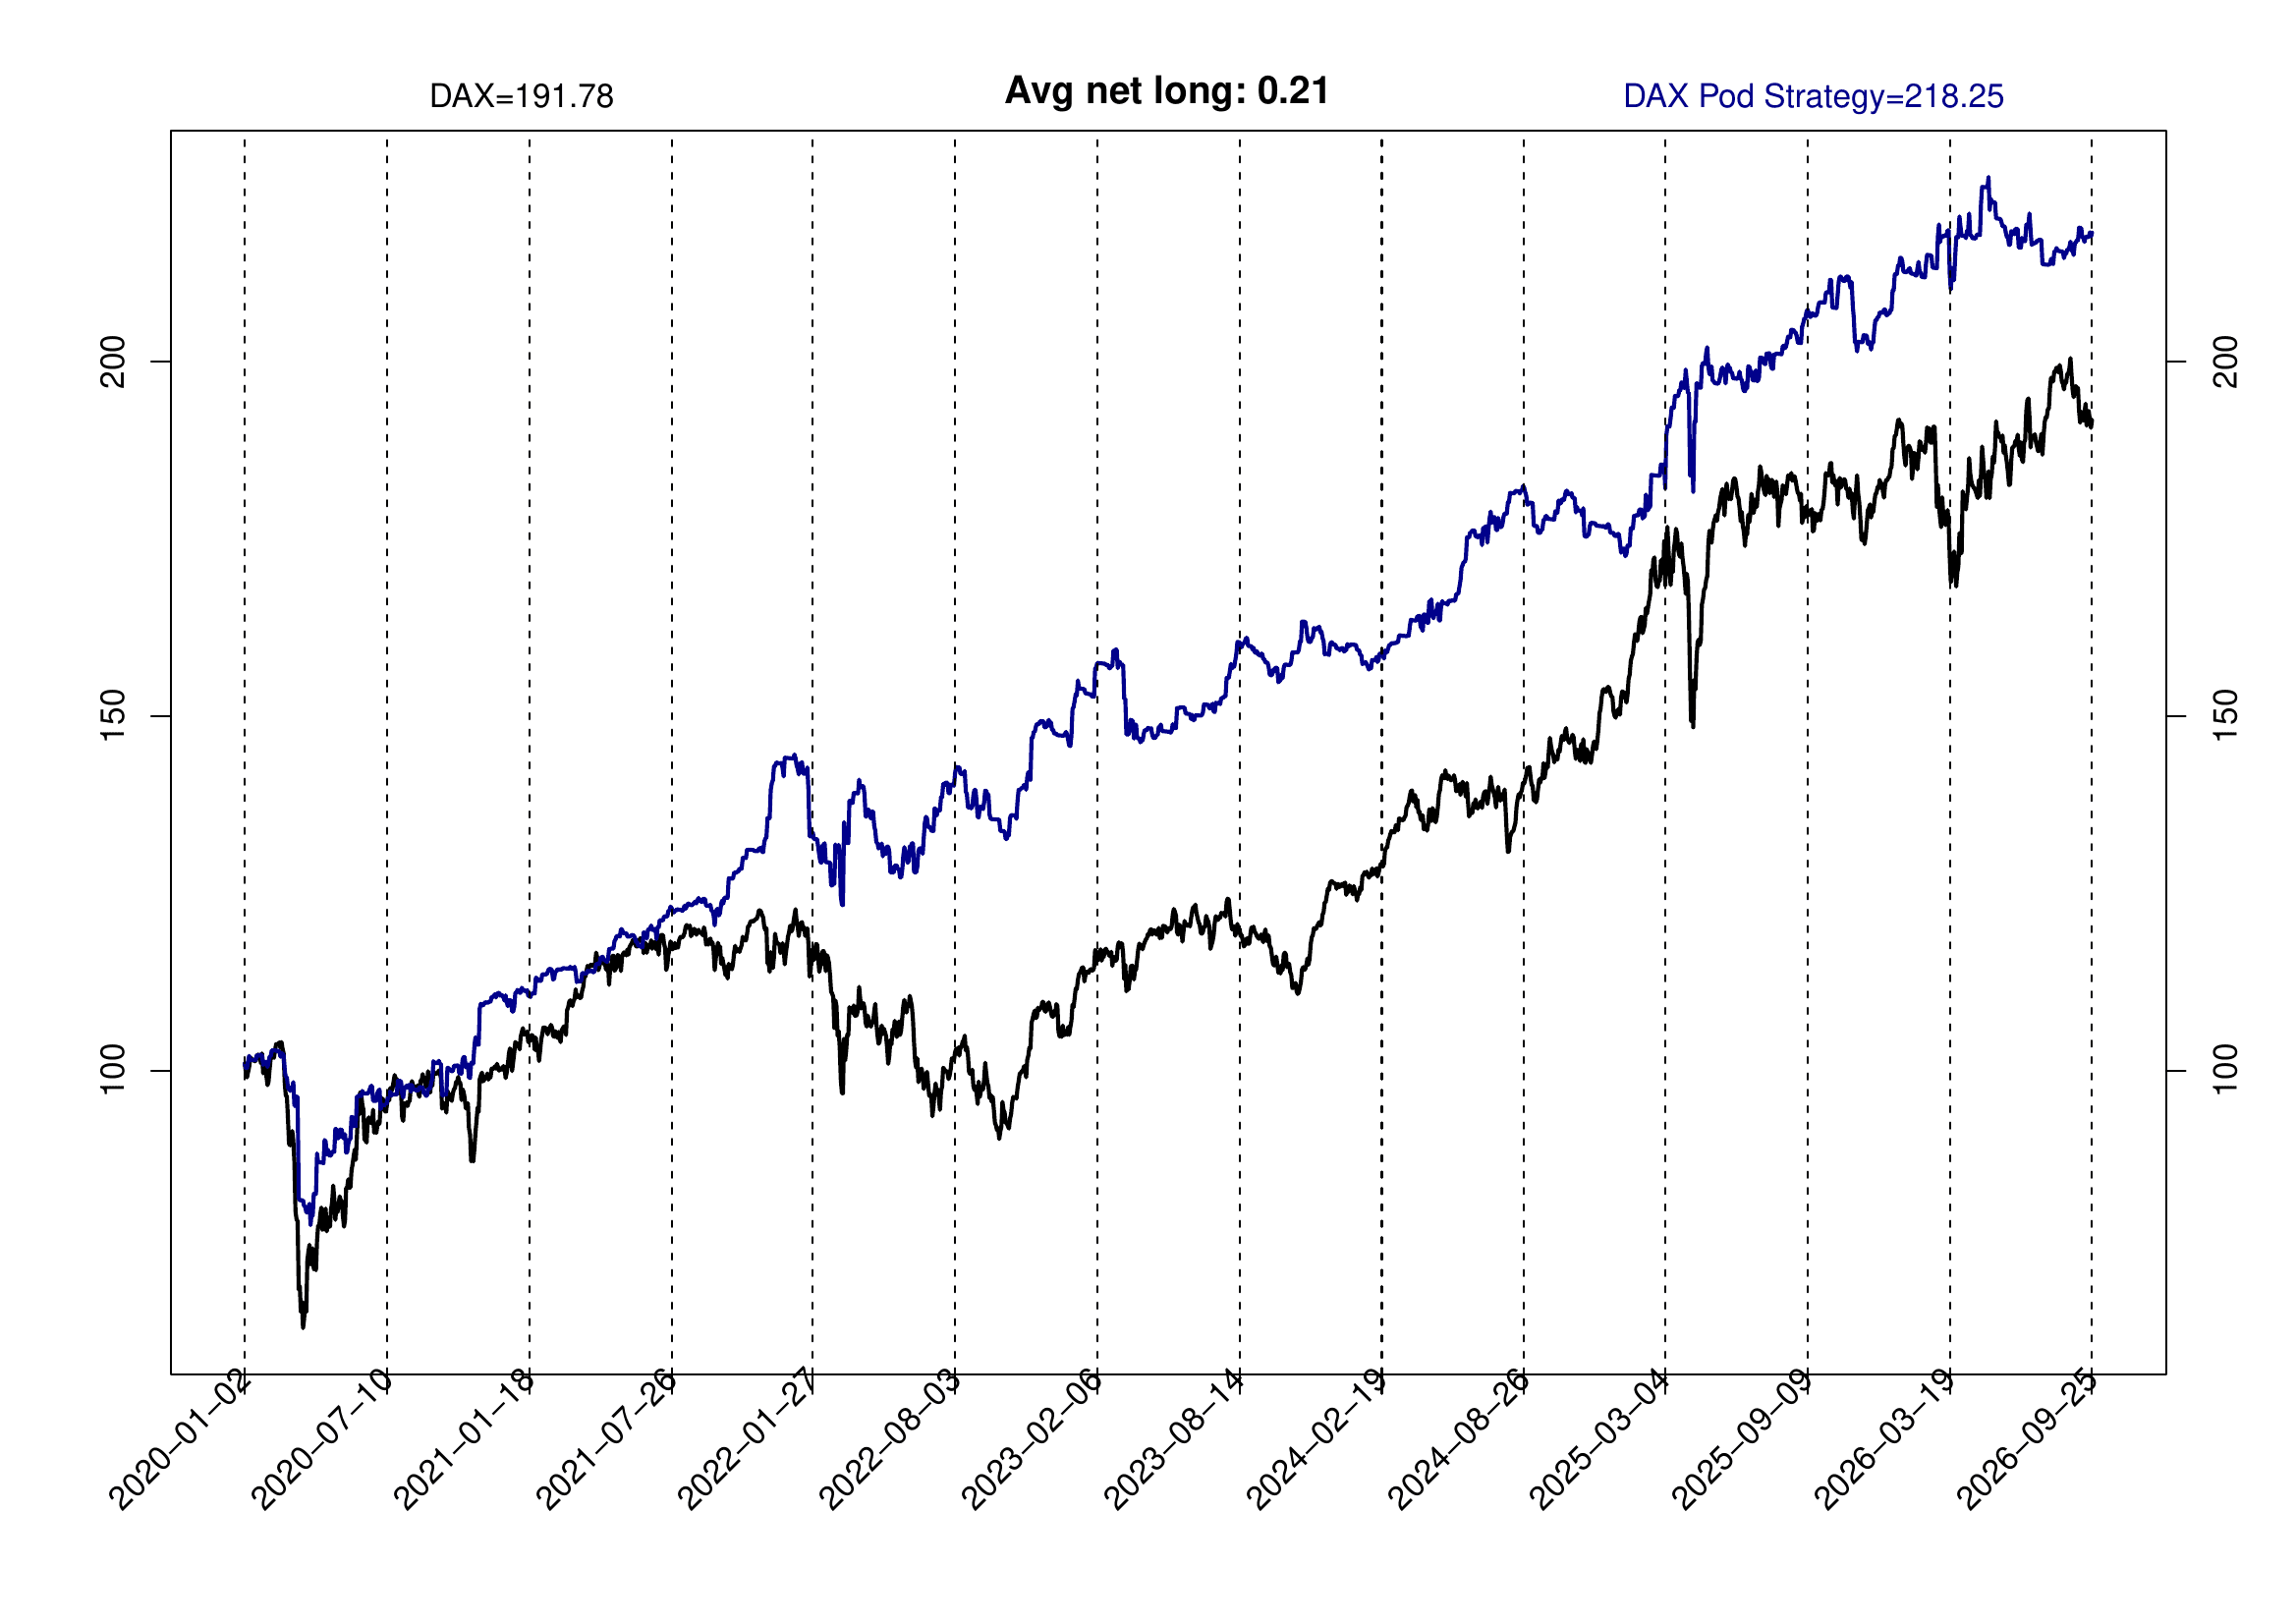
The third chart follows an investor who started on 1 January 2020, encompassing the COVID-19 sell-off and the market cycles that followed. By end-September 2026 the DAX cash index stood at 191.78 and the Pod Strategy at 218.25, with an average net exposure of 0.21 over the period.
Black line: DAX cash index benchmark. Blue line: DAX Pod Strategy. Click the chart to open it full size in a separate tab.
From 1 January 2023 to the fall of 2026
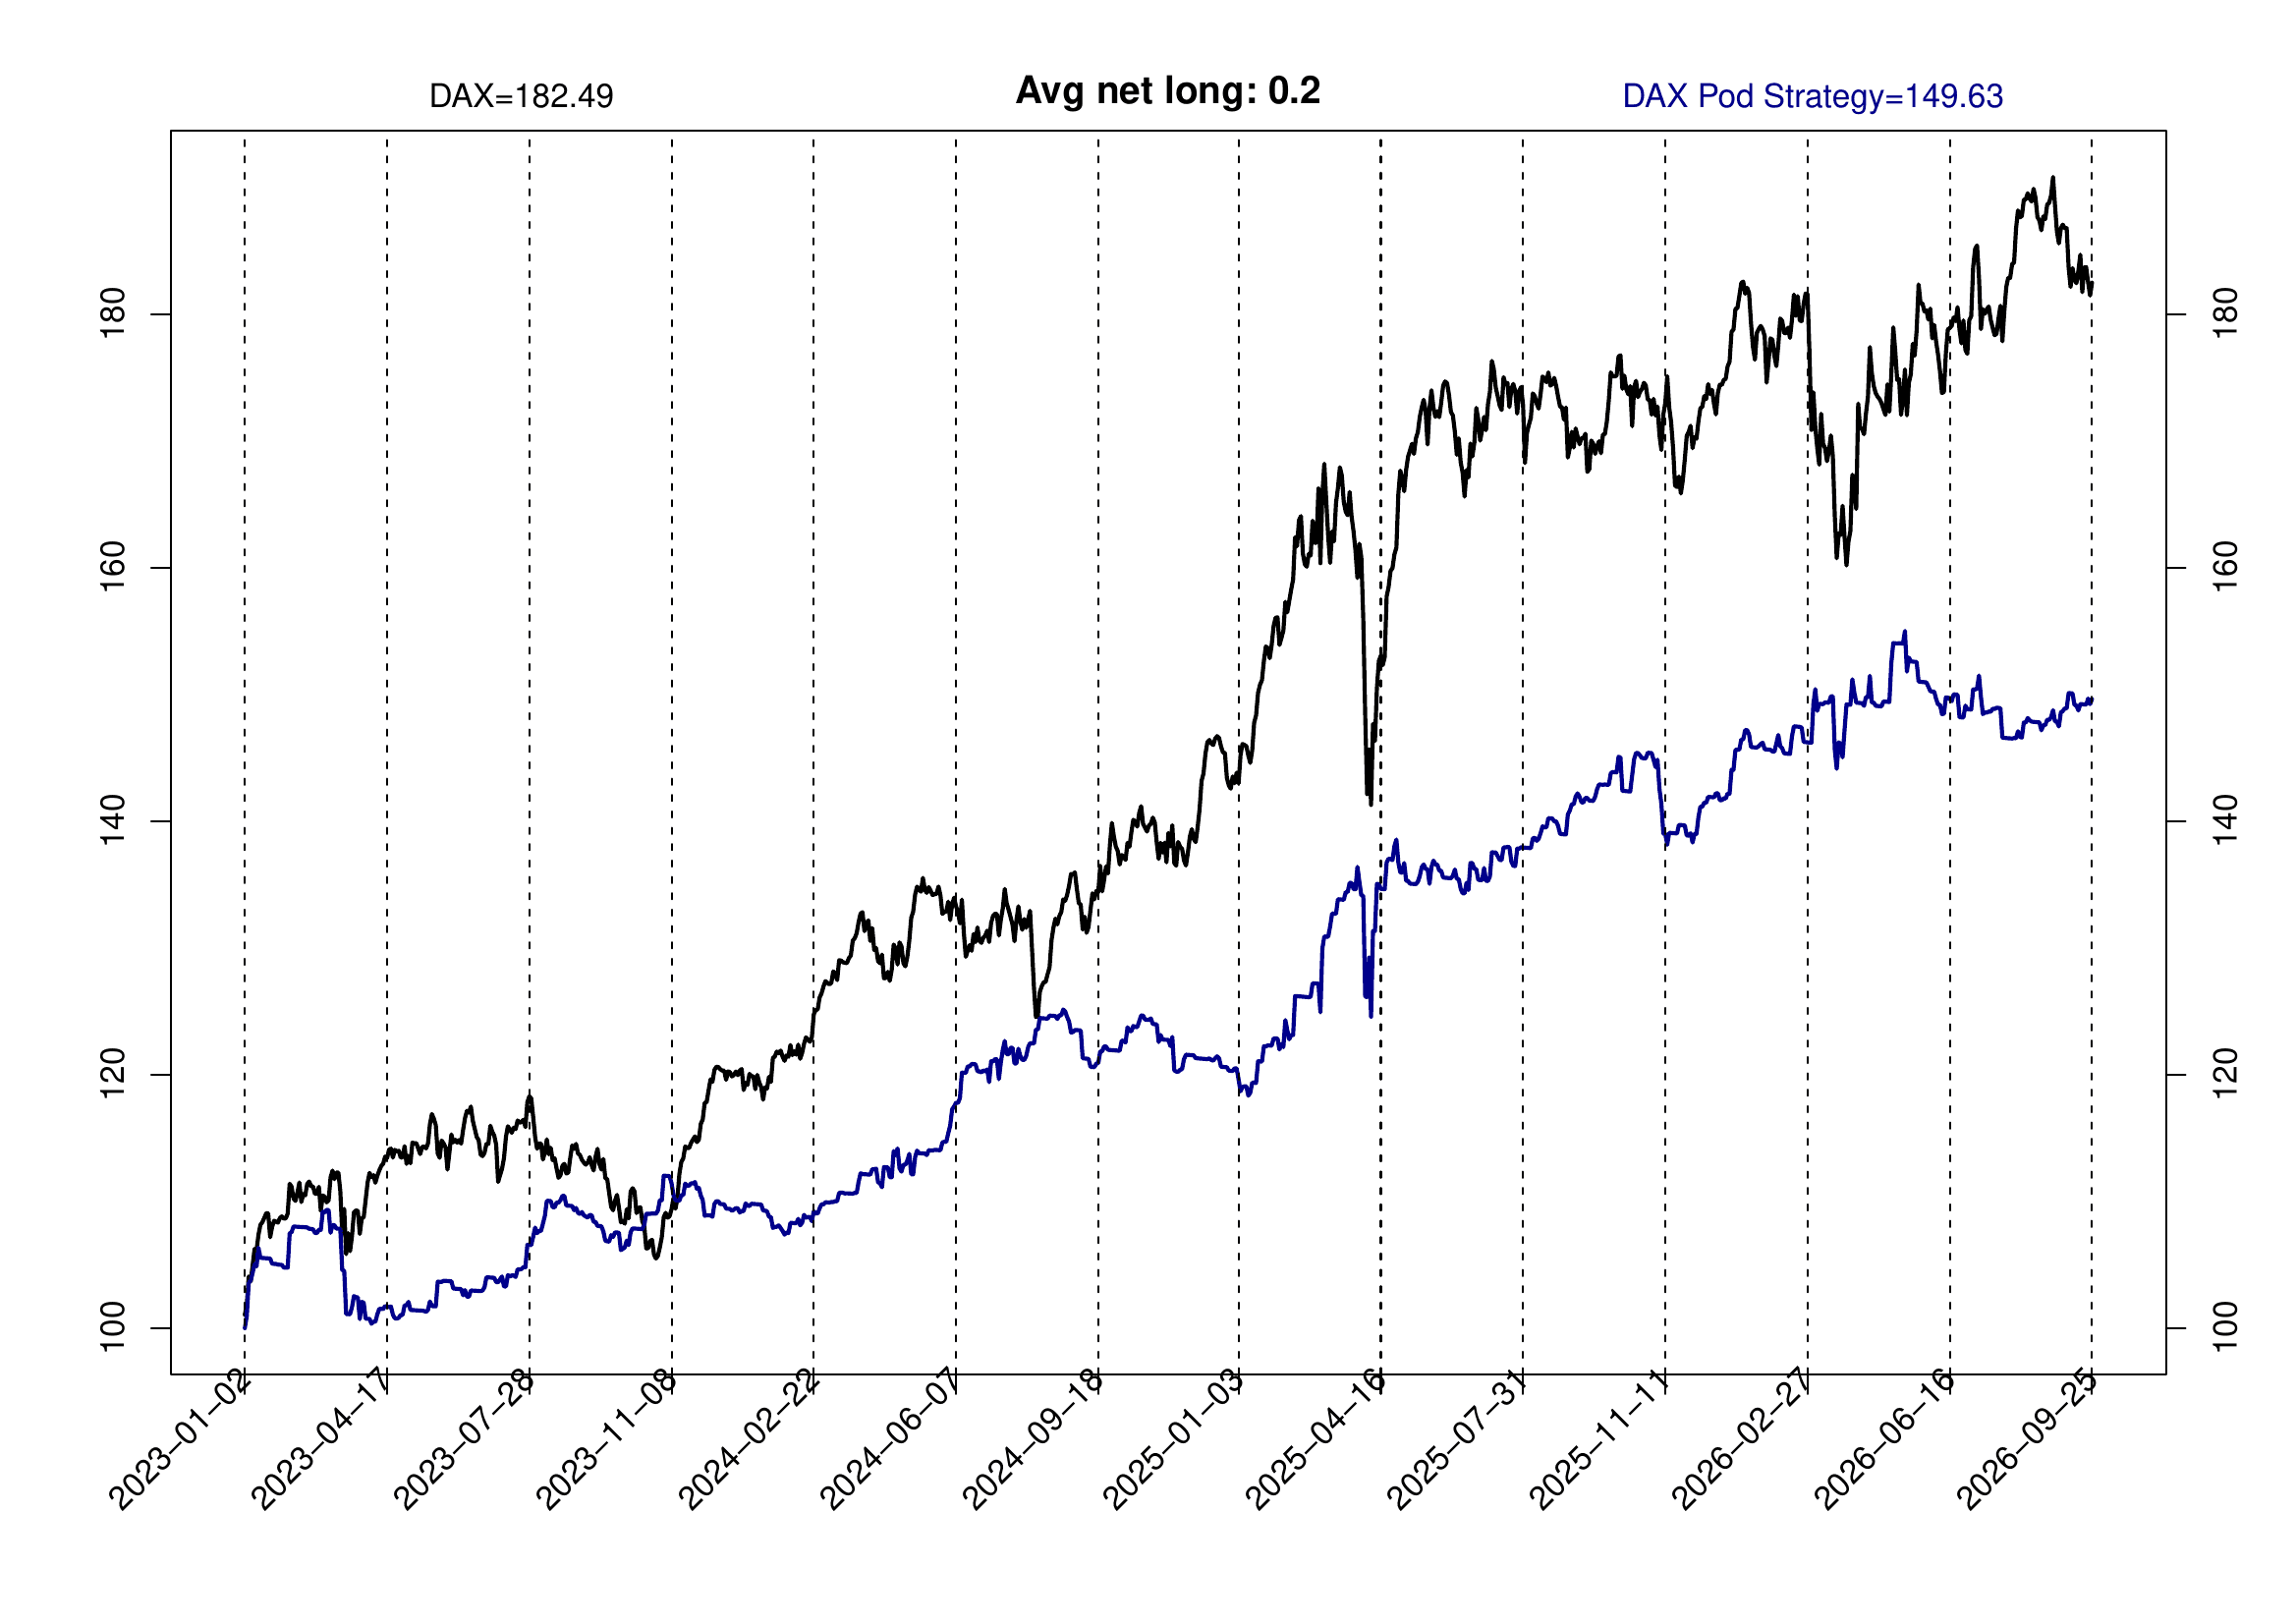
The fourth chart covers 1 January 2023 to the fall of 2026, a period that has on balance been a rising market for equities. Consistent with the exposure profile described above, the fully invested benchmark outpaced the strategy over this window: 100 euros in the DAX cash index grew to 182.49, while the Pod Strategy reached 149.63 with an average net exposure of 0.2. The lower exposure is visible in the far shallower drawdowns along the blue line.
Black line: DAX cash index benchmark. Blue line: DAX Pod Strategy. Click the chart to open it full size in a separate tab.
2026 only (year to date)
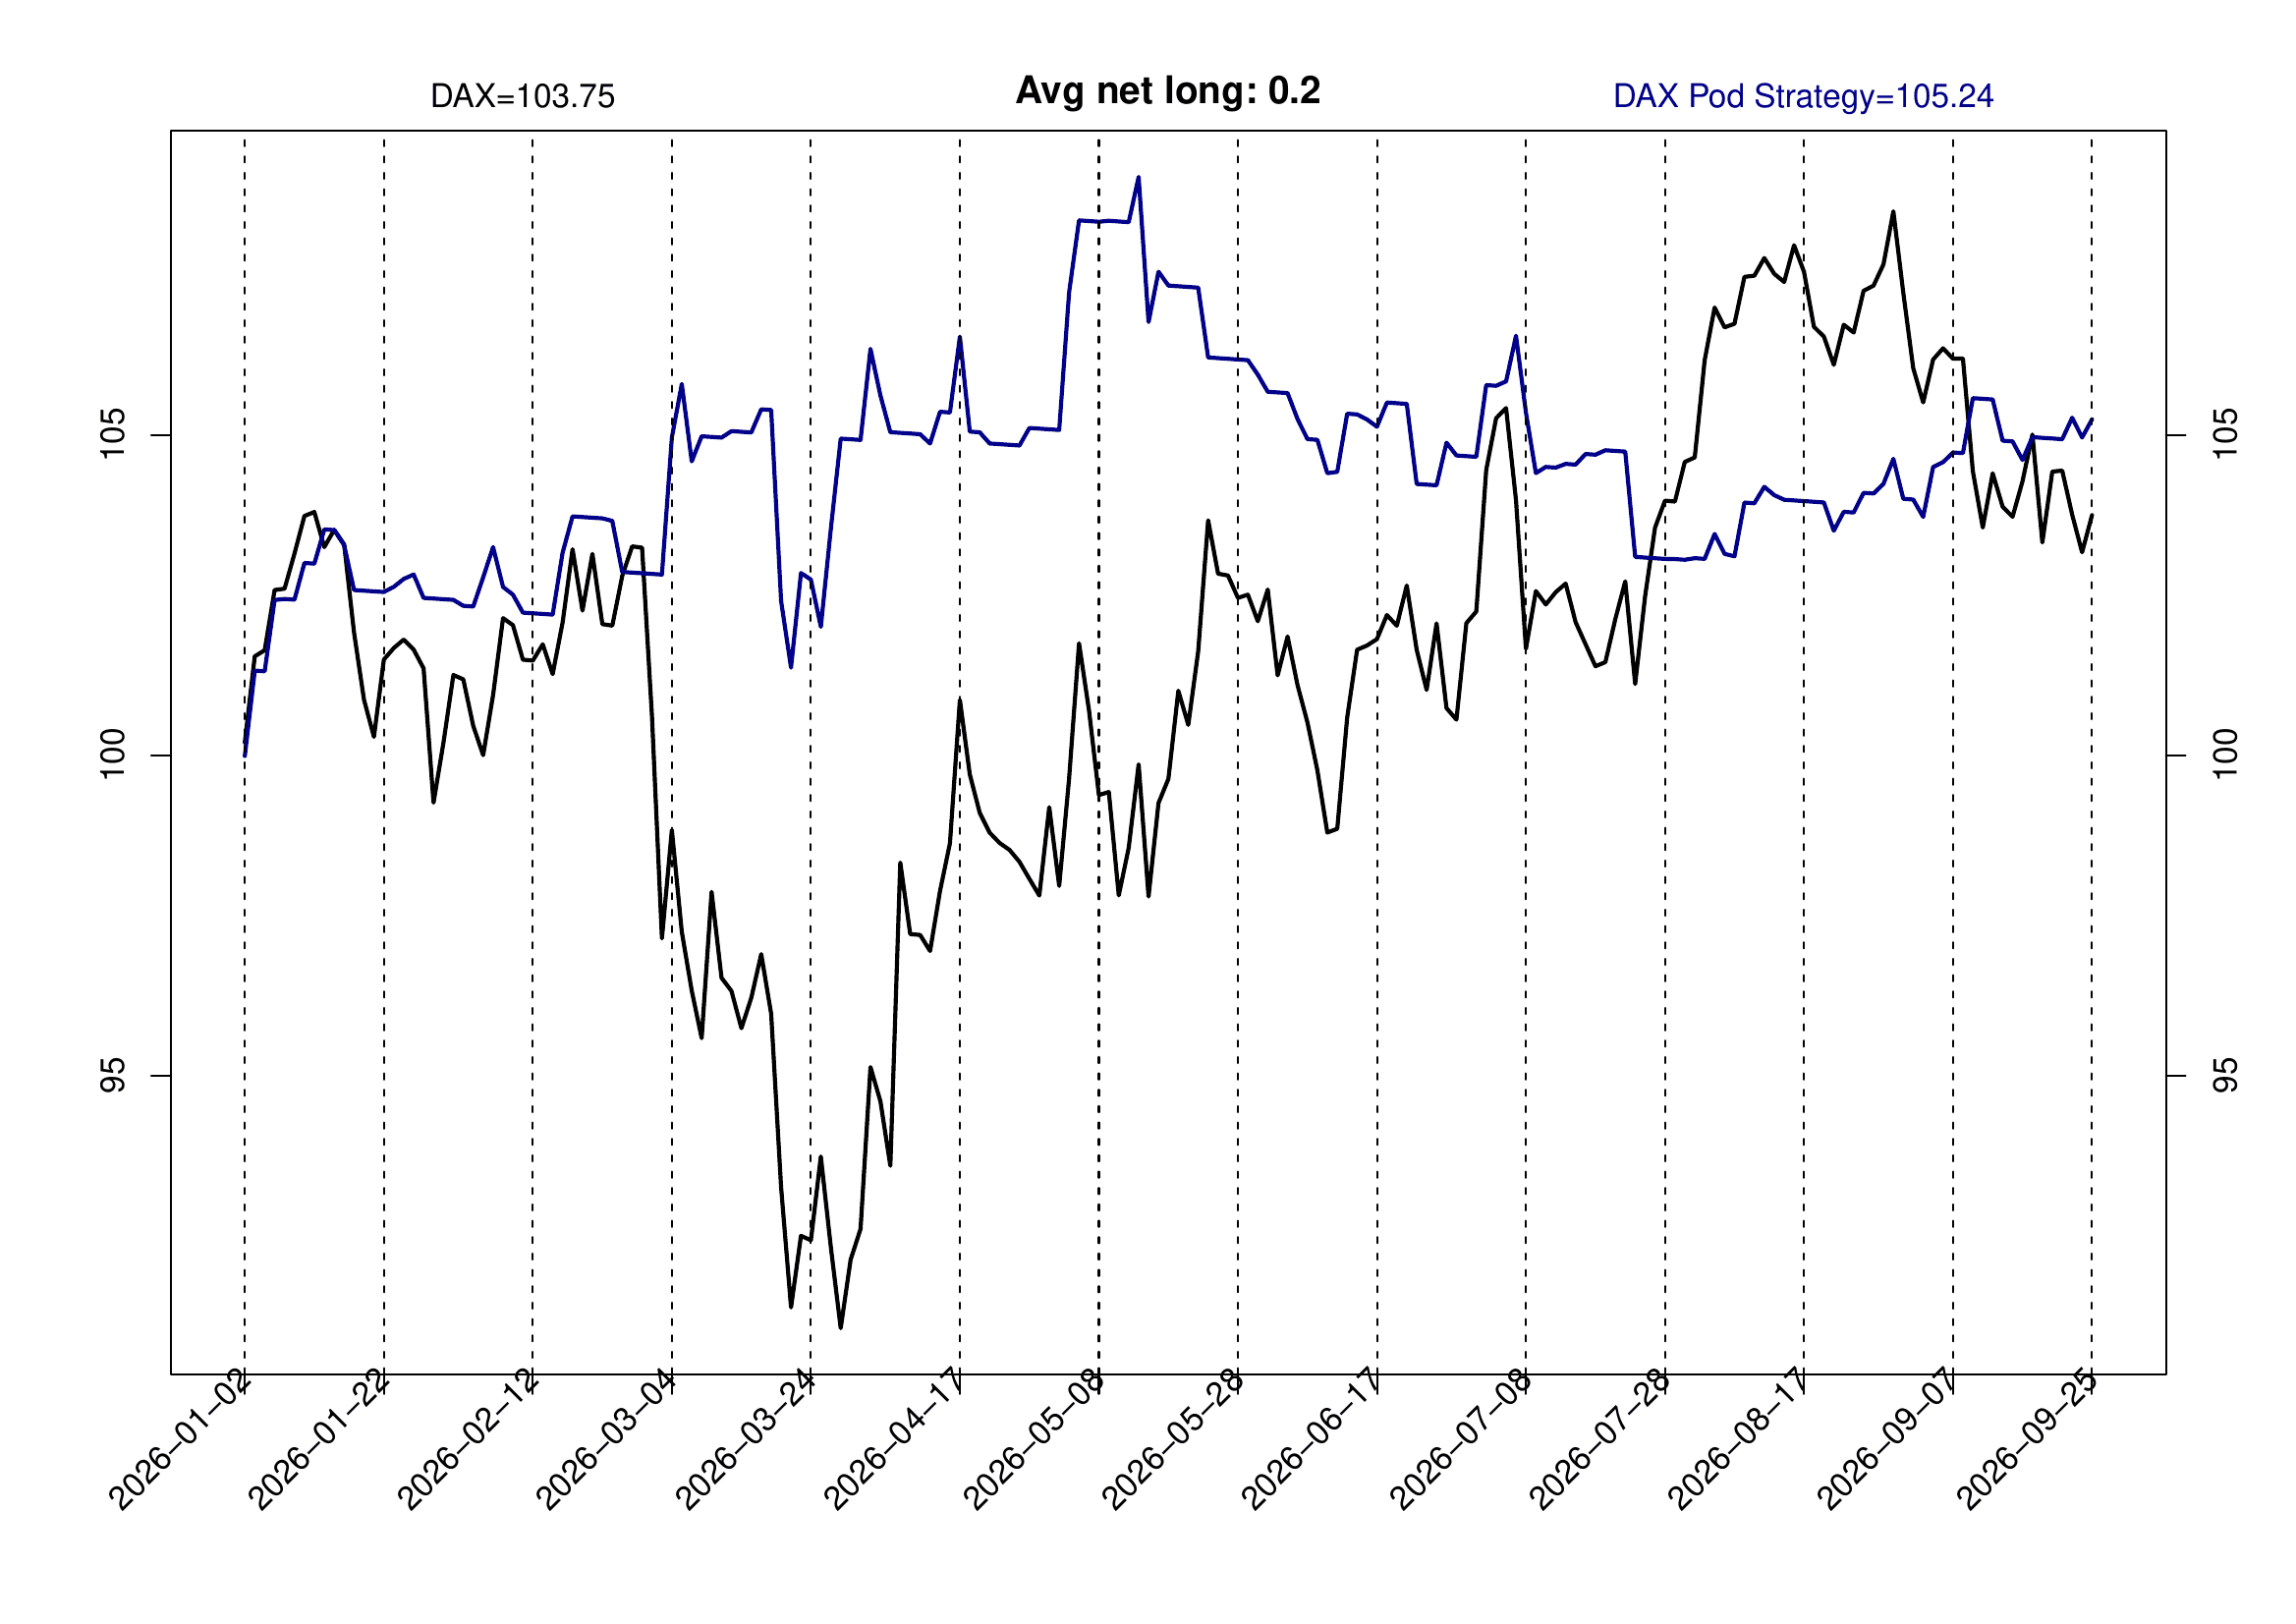
The fifth chart isolates the 2026 calendar year to date, through end-September. It illustrates the bear-market point in compact form: during the March 2026 decline the benchmark fell to roughly 91, while the strategy’s drawdown was far shallower. As markets recovered the benchmark closed much of the gap, and the period ends with the Pod Strategy modestly ahead at 105.24 versus 103.75 for the DAX cash index, with an average net exposure of 0.2.
Black line: DAX cash index benchmark. Blue line: DAX Pod Strategy. Click the chart to open it full size in a separate tab.
Backtested results are presented as observations only. They are not guarantees of future outcomes, and nothing on this page constitutes a recommendation to deal in any instrument or transaction.
For completeness, additional windows of the backtest are presented here as an appendix: the earliest years of the record, together with the 2020 and 2022 calendar years, each of which contains an important market decline.
From 1 January 1960 to the end of 1963
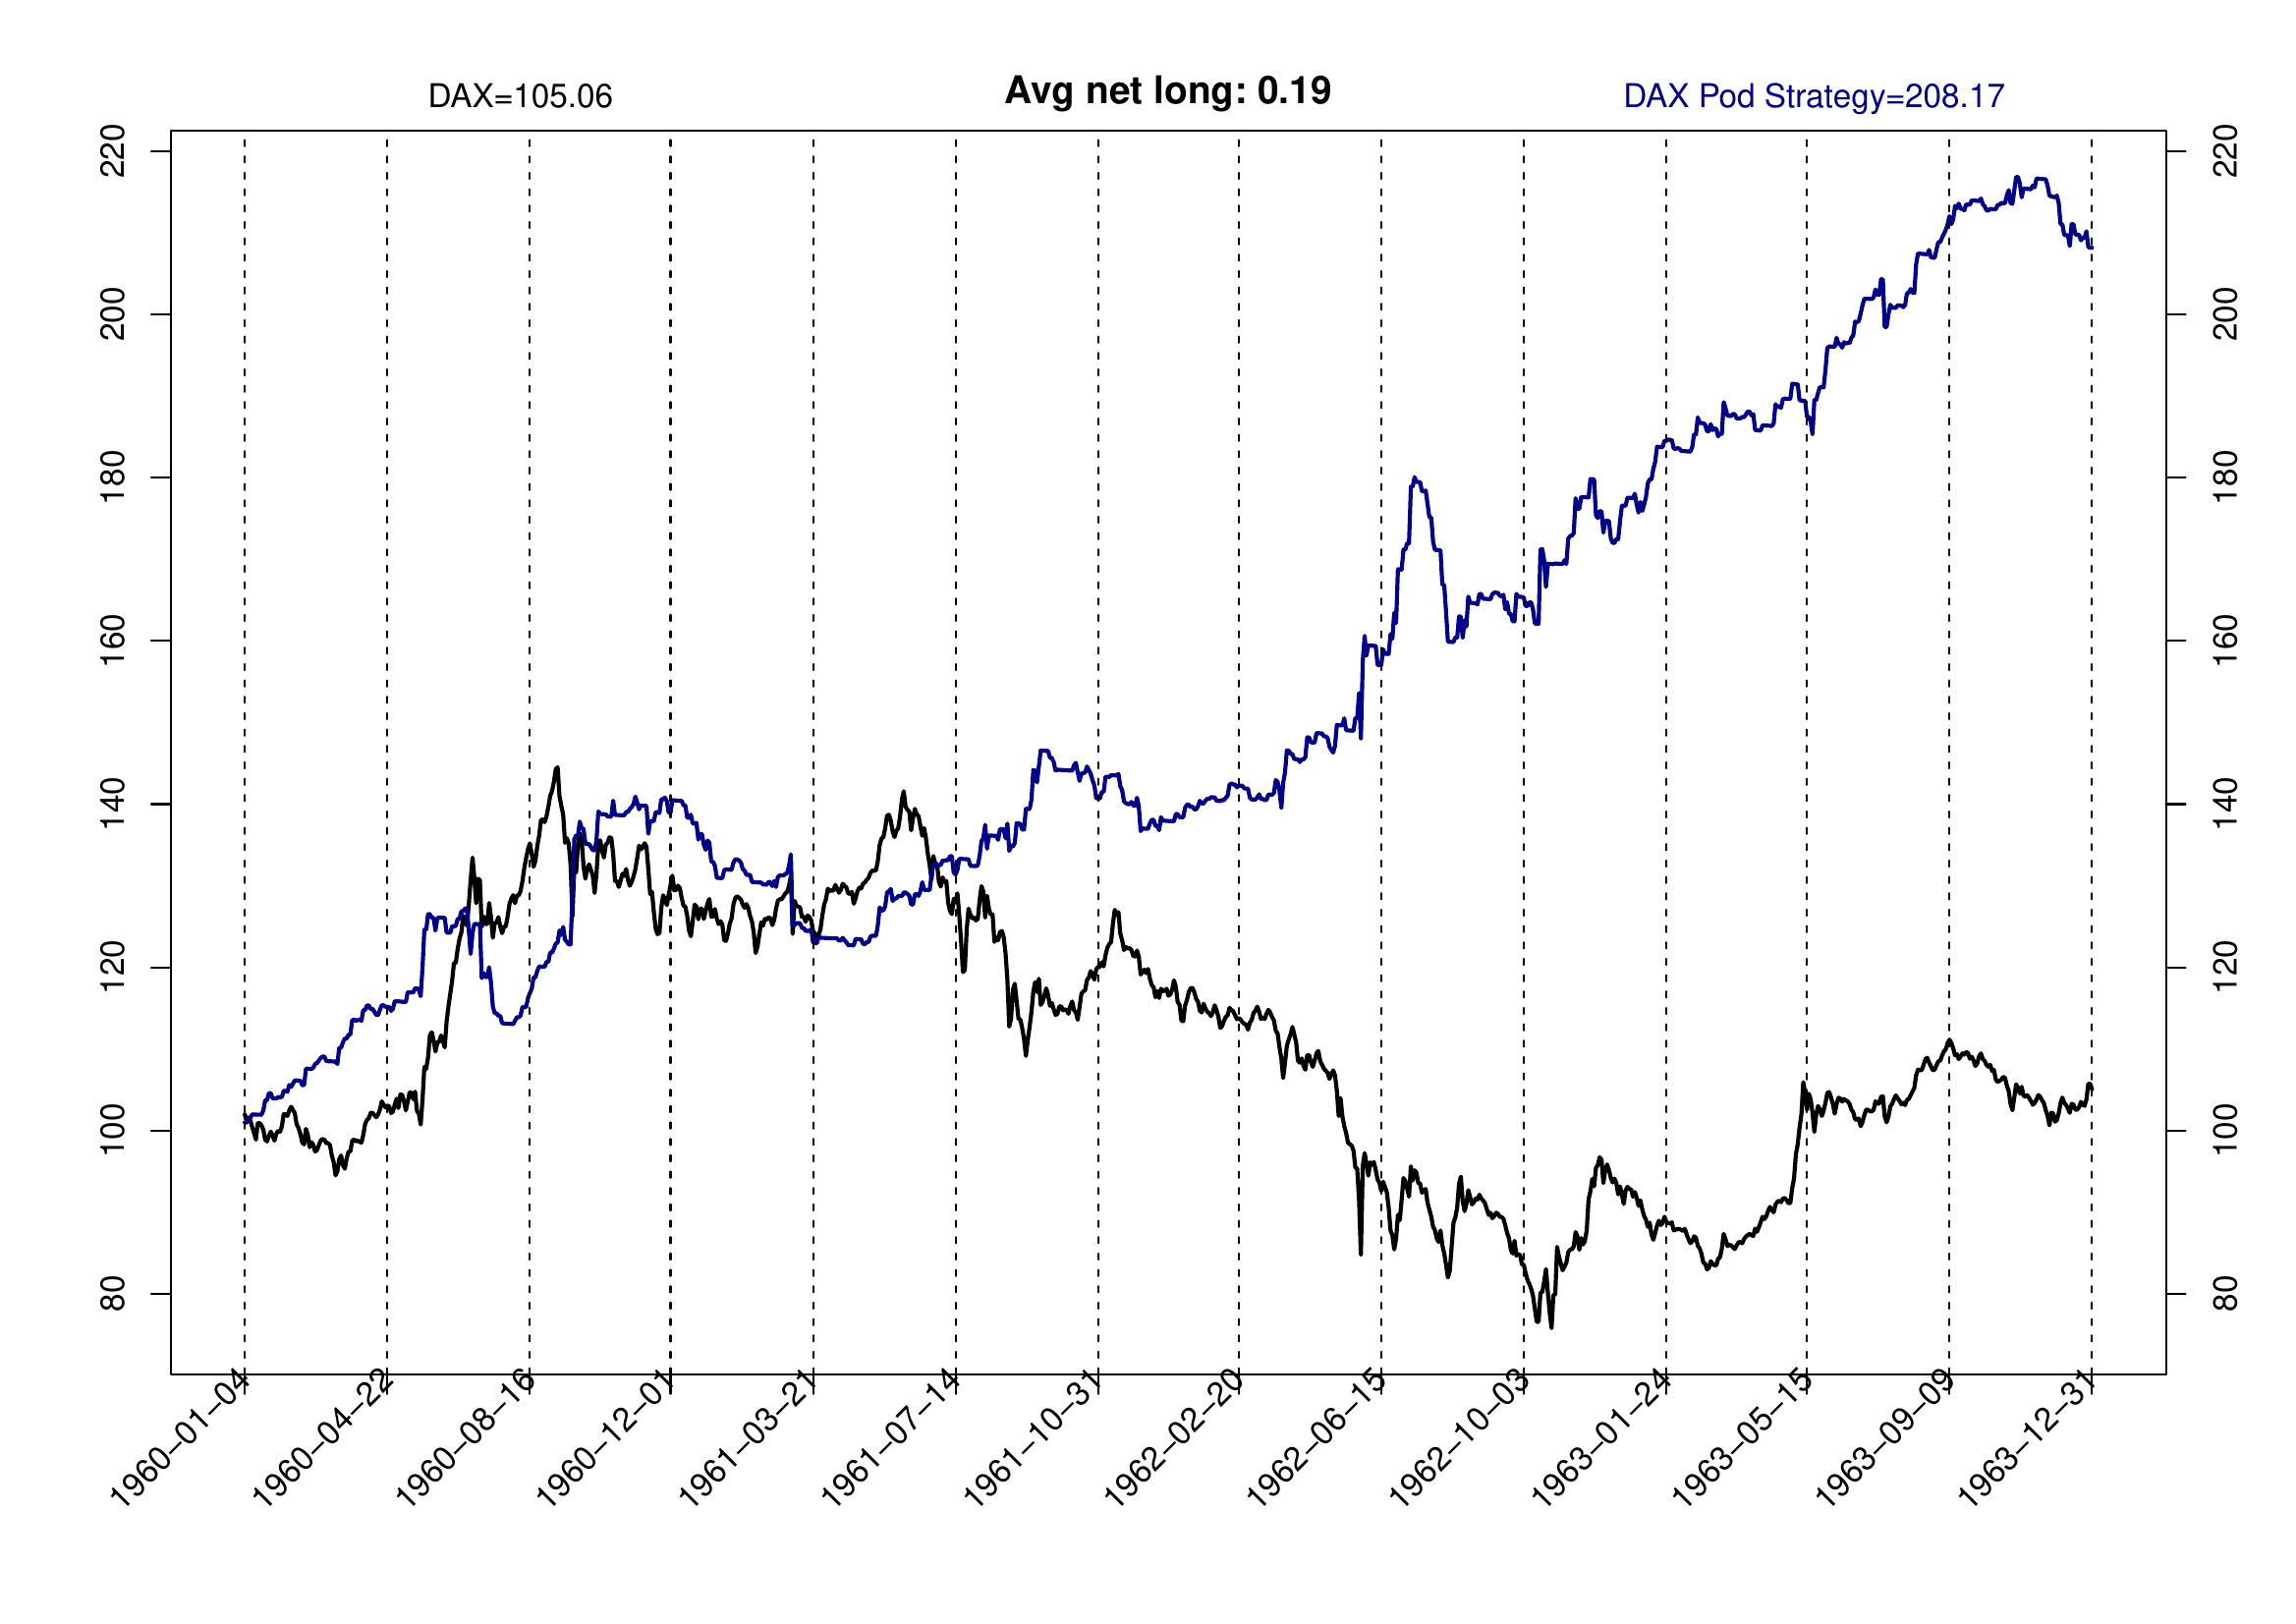
Over those four years the DAX cash index ended at 105.06, while the Pod Strategy ended at 208.17, with an average net exposure of 0.19. The window contains the 1962 bear market, in which the benchmark fell to roughly 75 before recovering — a further illustration of the bear-market behaviour described earlier on this page.
Black line: DAX cash index benchmark. Blue line: DAX Pod Strategy. Click the chart to open it full size in a separate tab.
The 2020 calendar year
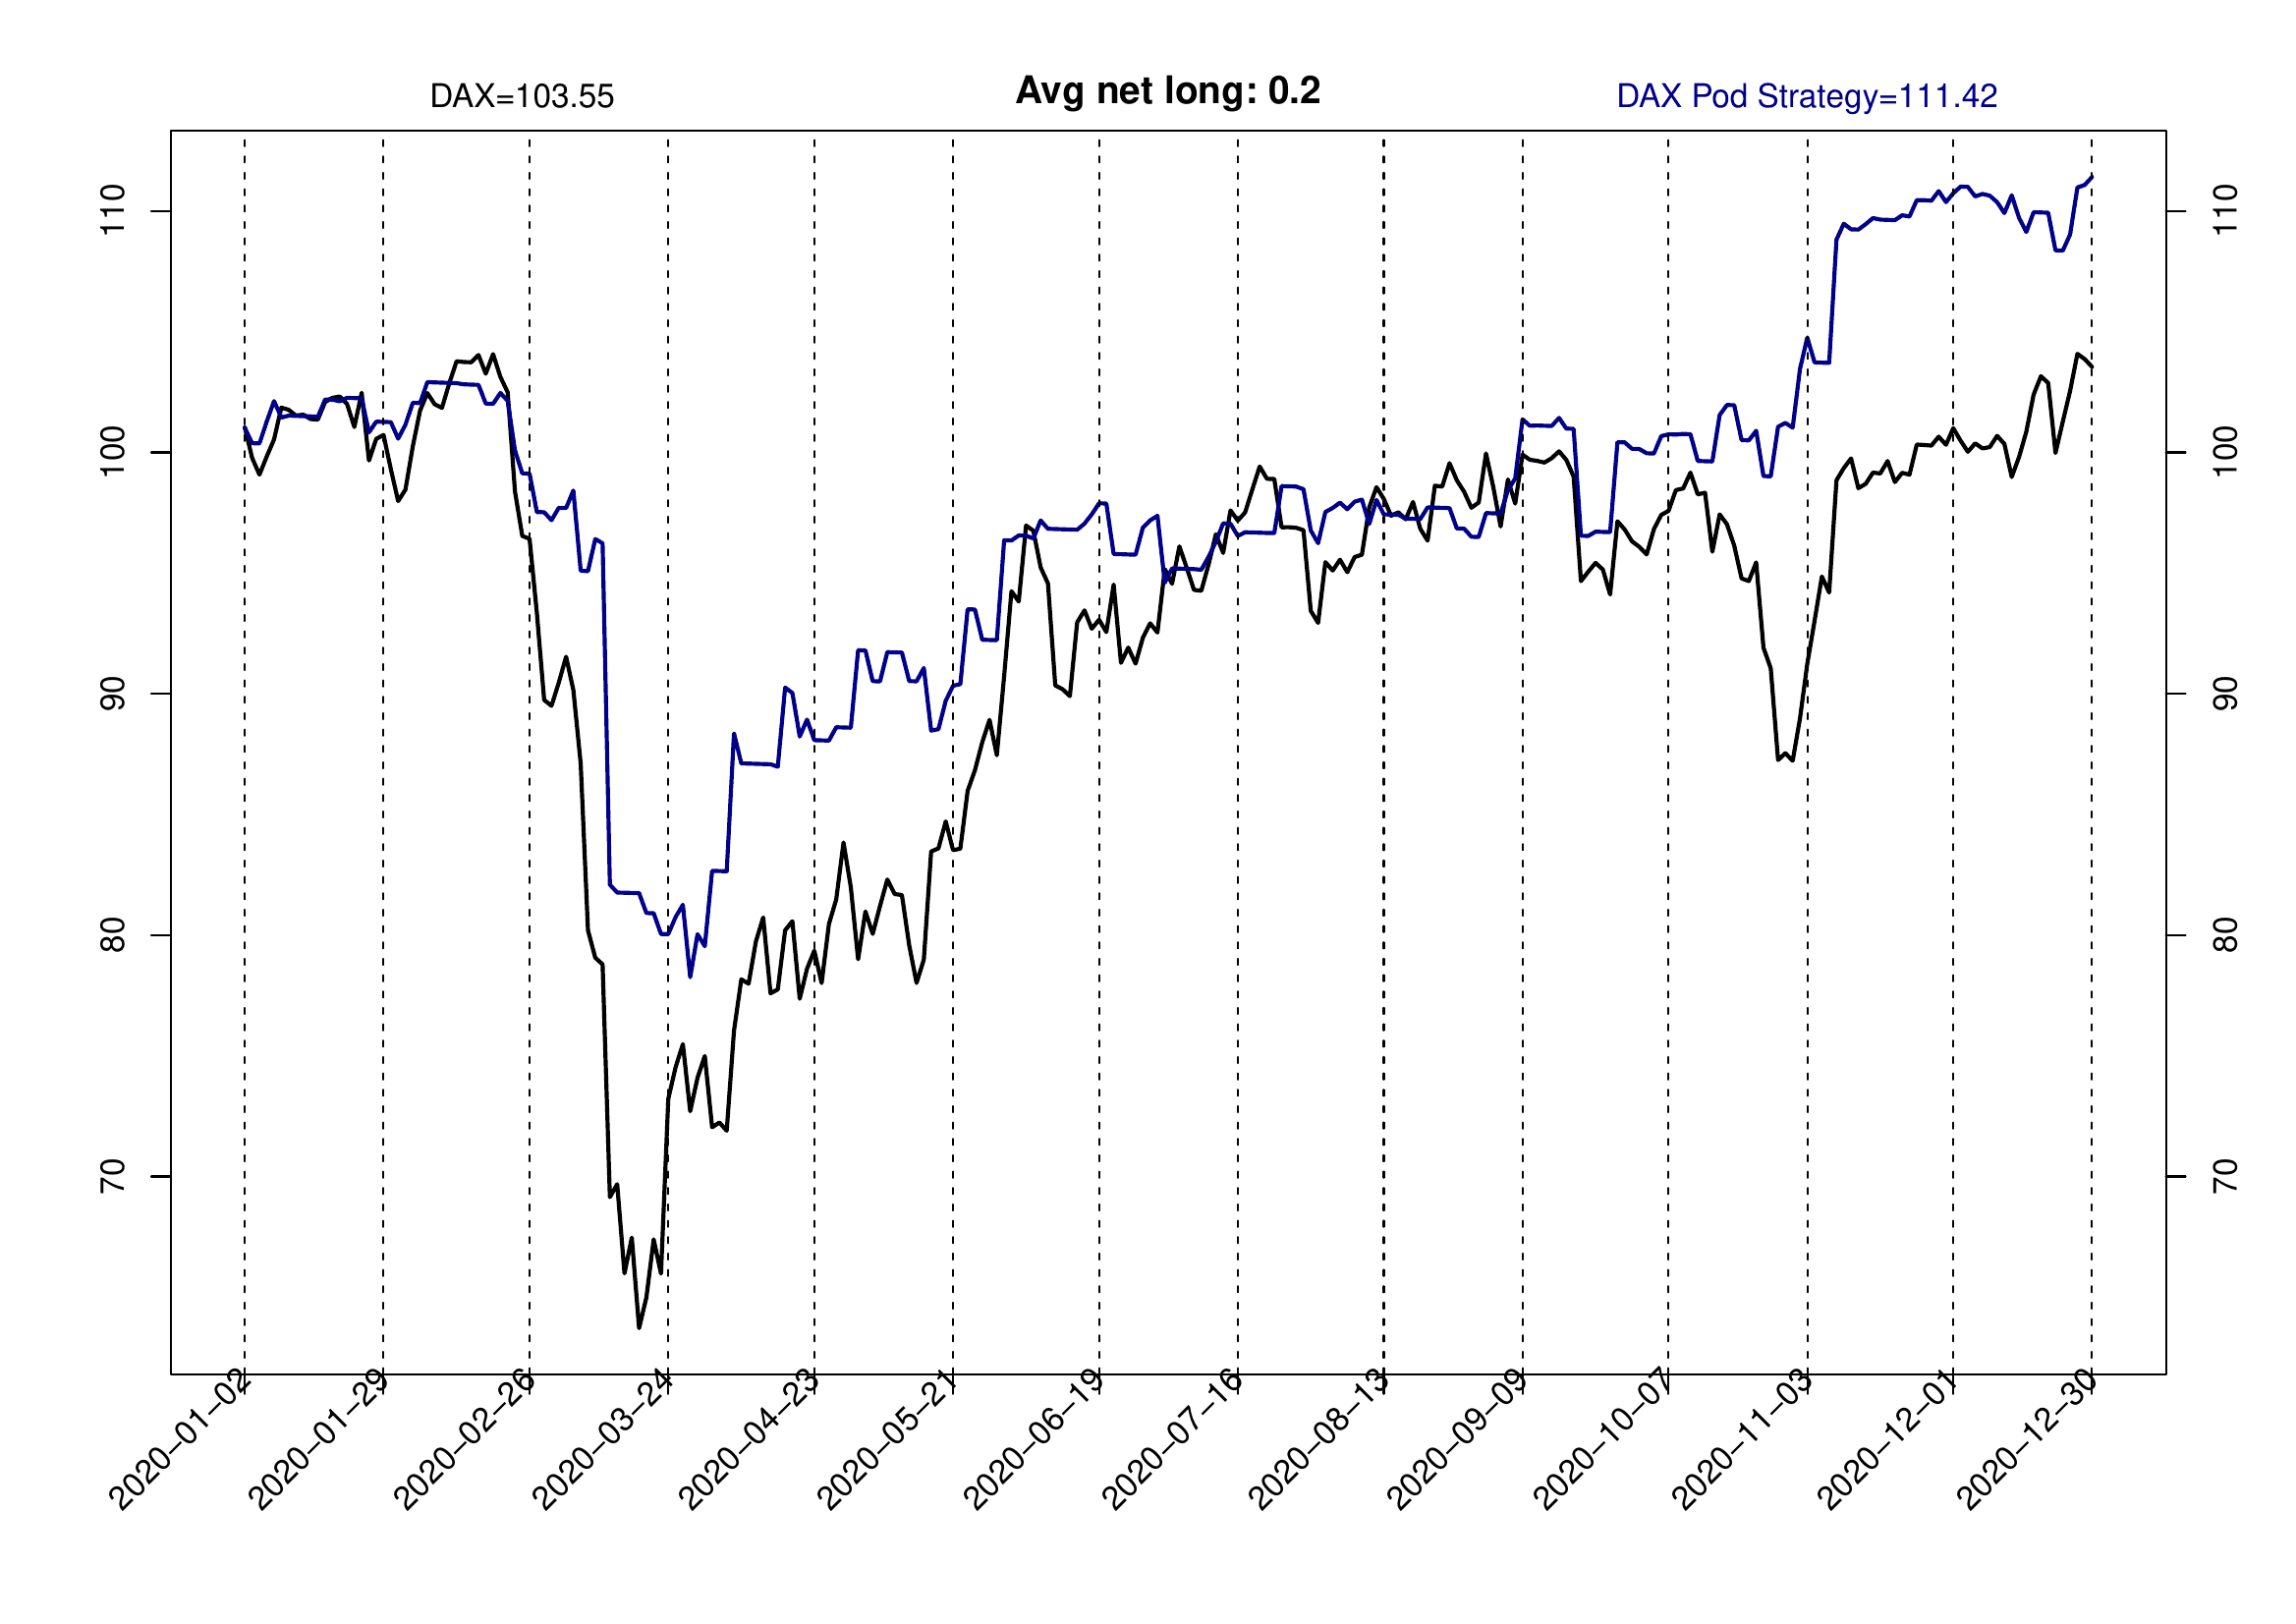
The 2020 calendar year follows an investor who started with 100 euros on 1 January 2020 and remained invested through the COVID-19 sell-off and the recovery that followed. During the February–March 2020 decline the benchmark fell to roughly 63 at its worst, while the strategy's drawdown was far shallower. By the end of the year the DAX cash index stood at 103.55 and the Pod Strategy at 111.42, with an average net exposure of 0.2 over the period.
Black line: DAX cash index benchmark. Blue line: DAX Pod Strategy. Click the chart to open it full size in a separate tab.
The 2022 calendar year
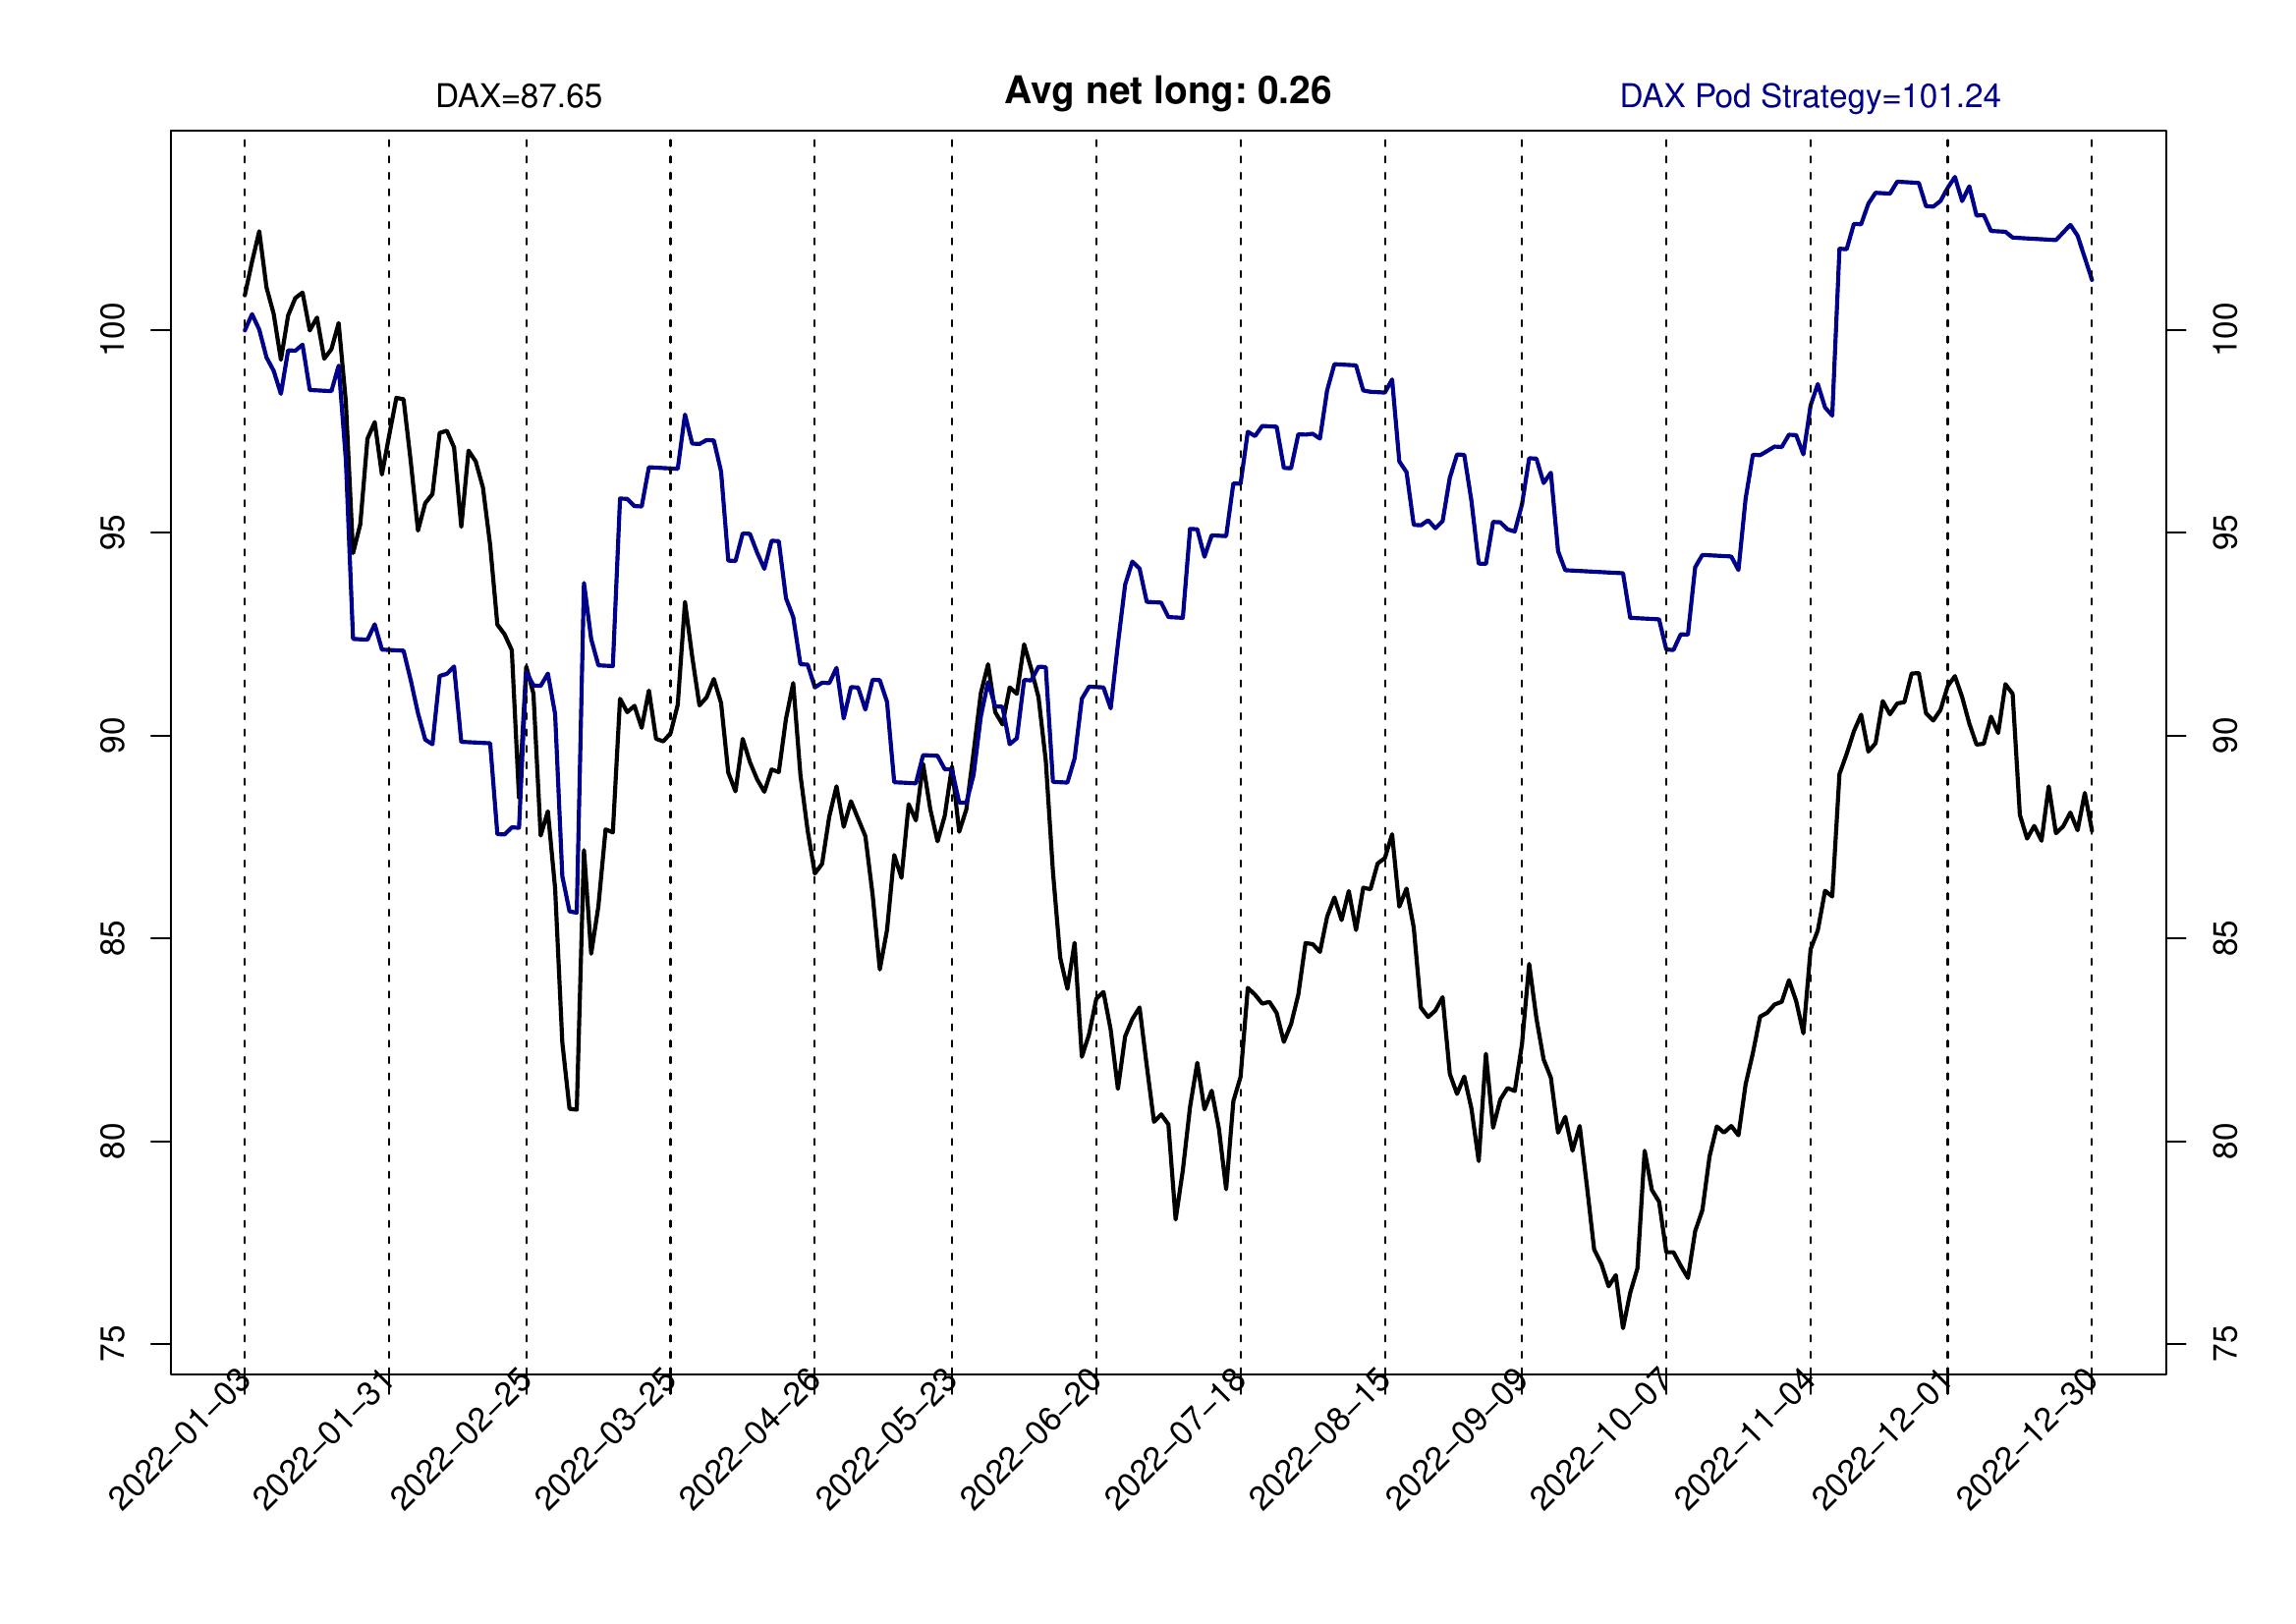
The 2022 calendar year covers a period that was on balance a declining market for equities. By the end of the year the DAX cash index stood at 87.65, while the Pod Strategy stood at 101.24, with an average net exposure of 0.26 over the period. The benchmark fell to roughly 75 at its September–October low, while the strategy's drawdowns were far shallower throughout.
Black line: DAX cash index benchmark. Blue line: DAX Pod Strategy. Click the chart to open it full size in a separate tab.