
MMB Advisers logoMMB Advisers

DAX

Combining the 12 TP candidate dates dial chart information with trendlines

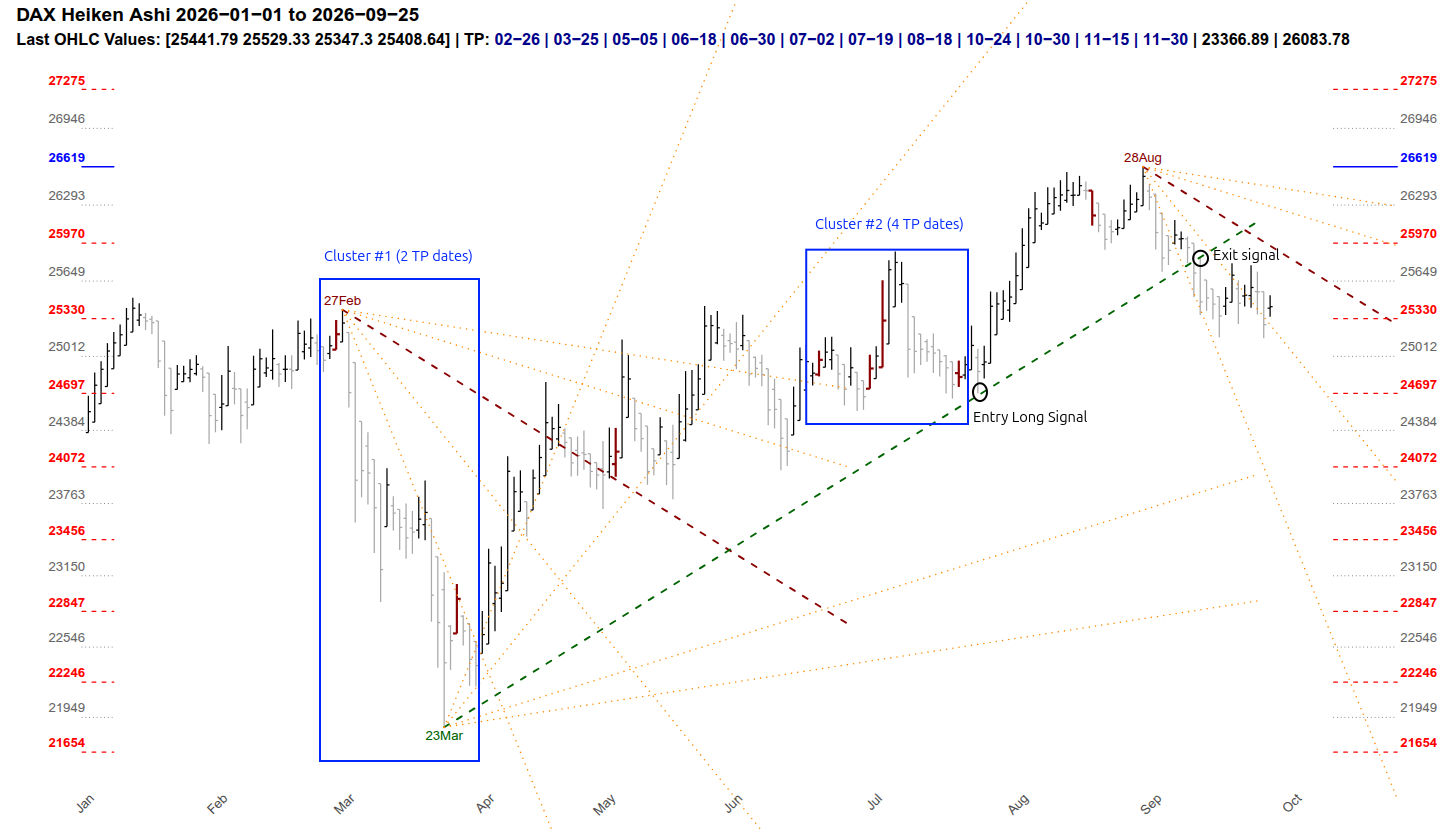
The chart below shows the DAX cash index represented as Heiken Ashi candles from 1 January 2026 to 25 September 2026. The overlaid annotations illustrate how the TP Dates CP (Turning Point Dates for Capital Protection) framework identifies candidate turning-point clusters and how those dates interact with primary trendline analysis.

Two clusters are highlighted on the chart, derived from our “12 TP Candidate Dates Dial Chart” shown in the Method page. Cluster #1 spans two Turning Point dates around the 27 February high and the 23 March low, capturing the drawdown that followed the February peak and the subsequent bounce. Cluster #2 groups four Turning Point dates in the June window, marking the consolidation that preceded the summer advance. The full list of 12 TP candidate dates for 2026 are reported in the sub-title of the chart, in blue colour. The price bars corresponding to such dates are reported in dark red colour in the chart. The last TP cluster for the year will be 24 Oct to 30 Nov 2026, a time window with high risk of decline.

The green dashed trendline supported the market from the March low through the summer, with an annotated entry long signal and a later exit signal as price approached the late-August high. The red dashed trendline descending from the February high is shown for context, together with key horizontal levels on either side of the price axis.

DAX Heiken Ashi chart from 1 January 2026 to 25 September 2026, showing TP date clusters, trendlines, entry and exit signals

Last OHLC values on 25 September 2026: open 25,441.79, high 25,529.33, low 25,347.30, close 25,408.64.

The TP dates marked on the chart are 26 February, 25 March, 5 May, 18 June, 30 June, 2 July, 19 July, 18 August, 24 October, 30 October, 15 November and 30 November 2026.

Click the chart to open it full size in a separate tab.

This chart is presented as an observation of how the TP Dates CP overlays and trendline analysis can be visualised on a single market. It is not a recommendation to enter into any trade, transaction, or investment action. Past observations are not a guarantee of future outcomes.